
Page 76 - IJPS-3-1
P. 76
Socioeconomic differentials and disease-free life expectancy of the elderly in Brazil
% 77.4 57.3 79.9 62.5 75.1 54.7 78.3 56.2 77.3 55.0 78.6 58.9
2008 DFLE 16.4 5.1 15.5 5.0 17.2 5.2 16.6 5.0 15.0 4.4 18.0 5.6
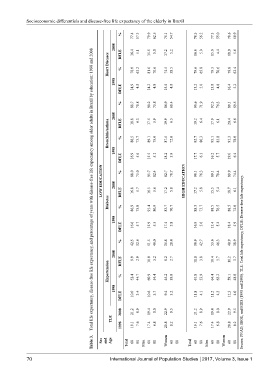
Total life expectancy, disease-free life expectancy, and percentage of years with disease-free life expectancy among older adults in Brazil by education: 1998 and 2008
Heart Diseases % 78.0 63.2 81.6 70.6 74.5 58.5 79.6 65.8 79.3 70.6 78.8 63.4
1998
DFLE 14.9 4.8 14.2 4.8 15.5 4.8 15.2 5.0 13.8 4.8 16.4 5.2
% 88.7 70.8 90.2 73.8 86.9 68.4 90.6 71.9 92.3 76.3 89.1 69.5
2008 DFLE 18.8 6.3 17.5 5.9 19.9 6.5 19.2 6.4 17.9 6.1 20.4 6.6
Bronchitis/asthma % 88.5 73.7 89.1 75.0 87.5 72.0 92.7 80.3 93.1 83.8 91.3 78.0
1998
DFLE 16.9 5.6 15.5 5.1 18.2 5.9 17.7 6.1 16.2 5.7 19.0 6.4
LOW EDUCATION 2008 % 88.0 16.8 75.0 5.7 93.7 16.3 82.4 5.6 82.7 17.2 70.7 5.8 HIGH EDUCATION 90.1 17.2 76.3 5.8 89.1 15.5 79.4 5.4 89.9 18.7 74.4 6.1
Diabetes DFLE % 86.9 75.0 91.4 80.9 83.7 70.7 88.5 73.7 88.5 76.5 88.5 72.0
1998
DFLE 16.6 5.7 15.9 5.5 17.4 5.8 16.9 5.6 15.4 5.2 18.4 5.9
% 42.5 32.6 51.5 40.0 35.8 28.4 50.9 42.7 53.6 46.3 48.9 38.9
2008 DFLE 9.0 2.9 10.0 3.2 8.2 2.7 10.8 3.8 10.4 3.7 11.2 3.7 Source: PNAD, IBGE, and MRS (1998 and 2008). TLE: Total life expectancy; DFLE: Disease-free life expectancy.
Hypertension % 52.4 44.7 60.9 54.4 45.2 39.0 61.8 53.9 64.4 63.2 59.1 48.8
1998
DFLE 10.0 3.4 10.6 3.7 9.4 3.2 11.8 4.1 11.2 4.3 12.3 4.0
2008 21.2 8.9 19.4 8.0 22.9 9.5 21.2 8.9 19.4 8.0 22.9 9.5
TLE
1998 19.1 7.6 17.4 6.8 20.8 8.2 19.1 7.6 17.4 6.8 20.8 8.2
Table 3. Sex and Age Total 60 80 Men 60 80 Women 60 80 Total 60 80 Men 60 80 Women 60 80
70 International Journal of Population Studies 2017, Volume 3, Issue 1