
Page 21 - IJPS-4-2
P. 21
Chirinda W, et al.
were based on the mid-year sex-specific complete life tables that were interpolated and smoothed from the abridged life
tables published by the United Nations (United Nations, 2017). We presented life tables in 10-year age intervals for each
gender, beginning with age 50 and having an open interval for age 80 and above. The reason for collapsing the ages was
to obtain more stable prevalence estimates. The United Nations life tables were available for the years - 2000–2005,
2005–2010, and 2010–2015. We used linear interpolation following a Lexis diagram approach to obtain life tables
to correspond with the survey years (i.e., 2005, 2008, and 2012). Standard errors were calculated from the formulae
suggested by the International Network on Health Expectancy (Jagger, Cox, and Le Roy, 2006). We calculated the age-
sex-specific HLE and the proportion of HLE to TLE over the period 2005–2012 to establish if there was an absolute or
relative expansion or compression of morbidity (European Health Expectancy Monitoring Unit, 2009) for the period.
3. Results
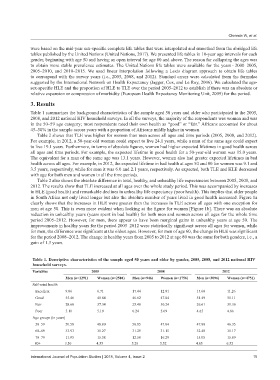
Table 1 summarizes the background characteristics of the sample aged 50 years and older who participated in the 2005,
2008, and 2012 national HIV household surveys. In all the surveys, the majority of the respondents was women and was
in the 50–59 age category; most respondents rated their own health as “good” or “fair.” Africans accounted for about
45–50% in the sample across years with a proportion of Africans mildly higher in women.
Table 2 shows that TLE was higher for women than men across all ages and time periods (2005, 2008, and 2012).
For example, in 2012, a 50-year-old woman could expect to live 24.1 years, while a man of the same age could expect
to live 19.1 years. Furthermore, in terms of absolute figures, women had higher expected lifetimes in good health across
all ages and time periods. For example, the expected lifetime in good health for a 50-year-old woman was 15.0 years.
The equivalent for a man of the same age was 13.1 years. However, women also had greater expected lifetimes in bad
health across all ages. For example, in 2012, the expected lifetime in bad health at ages 50 and 80 for women was 9.1 and
3.5 years, respectively, while for men it was 6.0 and 2.1 years, respectively. As expected, both TLE and HLE decreased
with age for both men and women in all the time periods.
Table 2 also shows the absolute difference in total, healthy, and unhealthy life expectancies between 2005, 2008, and
2012. The results show that TLE increased at all ages over the whole study period. This was accompanied by increases
in HLE (good health) and remarkable declines in unhealthy life expectancy (poor health). This implies that older people
in South Africa not only lived longer but also the absolute number of years lived in good health increased. Figure 1a
clearly shows that the increases in HLE were greater than the increases in TLE across all ages with one exception for
men at age 50. This is even more evident when looking at the figure for women [Figure 1b]. There was an absolute
reduction in unhealthy years (years spent in bad health) for both men and women across all ages for the whole time
period 2005–2012. However, for men, there appear to have been marginal gains in unhealthy years at age 50. The
improvements in healthy years for the period 2005–2012 were statistically significant across all ages for women, while
for men, the difference was significant at the oldest ages. However, for men of age 60, the change in HLE was significant
for the period 2008–2012. The change in healthy years from 2005 to 2012 at age 80 was the same for both genders, i.e., a
gain of 1.3 years.
Table 1. Descriptive characteristics of the sample aged 50 years and older by gender, 2005, 2008, and 2012 national HIV
household surveys.
Variables 2005 2008 2012
Men (n=1291) Women (n=2504) Men (n=946) Women (n=1756) Men (n=3096) Women (n=4751)
Self-rated health
Excellent 9.06 6.71 17.44 12.81 15.60 11.26
Good 55.46 48.84 46.62 47.04 51.49 51.11
Fair 28.66 37.34 25.48 30.24 26.61 31.36
Poor 5.11 5.19 6.24 5.69 4.65 4.86
Age groups (in years)
50–59 50.58 48.80 50.85 47.04 47.80 46.35
60–69 33.93 31.27 31.29 31.15 32.40 31.17
70–79 11.93 15.38 12.58 16.29 15.05 15.89
80+ 3.56 4.55 5.29 5.52 4.65 6.52
International Journal of Population Studies | 2018, Volume 4, Issue 2 15