
Page 23 - IJPS-4-2
P. 23
Chirinda W, et al.
a
b
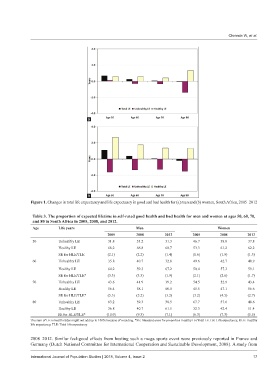
Figure 1. Changes in total life expectancy and life expectancy in good and bad health for (a) men and (b) women, South Africa, 2005–2012
Table 3. The proportion of expected lifetime in self-rated good health and bad health for men and women at ages 50, 60, 70,
and 80 in South Africa in 2005, 2008, and 2012.
Age Life years Men Women
2005 2008 2012 2005 2008 2012
50 Unhealthy LE 31.8 33.2 31.3 46.7 38.8 37.8
Healthy LE 68.2 66.8 68.7 53.3 61.2 62.2
SE for HLE/TLE (2.1) (2.2) (1.4) (1.6) (1.9) (1.3)
60 Unhealthy LE 35.8 40.7 32.8 49.6 42.7 40.9
Healthy LE 64.2 59.3 67.2 50.4 57.3 59.1
SE for HLE/TLE* (3.3) (3.3) (1.9) (2.1) (2.6) (1.7)
70 Unhealthy LE 43.6 41.9 39.2 54.5 52.9 43.4
Healthy LE 56.4 58.1 60.8 45.5 47.1 56.6
SE for HLE/TLE* (5.3) (5.2) (3.2) (3.2) (4.5) (2.7)
80 Unhealthy LE 63.2 59.3 38.5 67.7 57.6 48.6
Healthy LE 36.8 40.7 61.5 32.3 42.4 51.4
SE for HLE/TLE* (10.0) (9.3) (7.1) (6.3) (7.3) (5.5)
The sum of LE in health states might not add up to 100% because of rounding. *SE: Standard error for proportion Healthy LE/Total LE. LE: Life expectancy, HLE: Healthy
life expectancy, TLE: Total life expectancy
2008–2012. Similar feel-good effects from hosting such a mega sports event were previously reported in France and
Germany (Dutch National Committee for International Cooperation and Sustainable Development, 2008). A study from
International Journal of Population Studies | 2018, Volume 4, Issue 2 17