
Page 22 - IJPS-4-2
P. 22
Trends in healthy life expectancy among older adults in South Africa
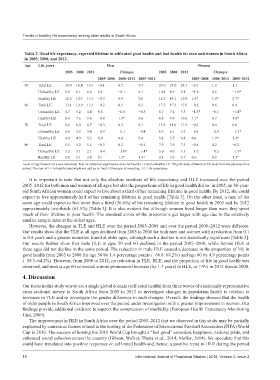
Table 2. Total life expectancy, expected lifetime in self-rated good health and bad health for men and women in South Africa
in 2005, 2008, and 2012.
Age Life years Men Women
2005 2008 2012 Changes 2005 2008 2012 Changes
2005–2008 2008–2012 2005–2012 2005–2008 2008–2012 2005–2012
50 Total LE 18.4 18.4 19.1 −0.1 0.7 0.7 23.0 23.0 24.1 −0.1 1.2 1.1
Unhealthy LE 5.9 6.1 6.0 0.2 −0.1 0.1 10.8 8.9 9.1 −1.8 0.2 −1.6*
Healthy LE 12.6 12.3 13.1 −0.3 0.9 0.6 12.3 14.1 15.0 1.8* 1.0* 2.7*
60 Total LE 13.1 12.9 13.3 −0.2 0.5 0.3 17.5 17.3 17.9 −0.2 0.6 0.4
Unhealthy LE 4.7 5.2 4.4 0.6 −0.9 −0.3 8.7 7.4 7.3 −1.3* −0.1 −1.4*
Healthy LE 8.4 7.6 9.0 −0.8 1.3* 0.6 8.8 9.9 10.6 1.1* 0.7 1.8*
70 Total LE 8.6 8.4 8.7 −0.3 0.3 0.1 11.9 11.6 11.9 −0.3 0.4 0.0
Unhealthy LE 3.8 3.5 3.4 −0.3 −0.1 −0.4 6.5 6.1 5.2 −0.4 −0.9 −1.3*
Healthy LE 4.9 4.9 5.3 0.0 0.4 0.4 5.4 5.5 6.8 0.0 1.3* 1.3*
80 Total LE 5.5 5.2 5.5 −0.3 0.2 −0.1 7.5 7.0 7.3 −0.4 0.2 −0.2
Unhealthy LE 3.5 3.1 2.1 −0.4 −1.0* −1.4* 5.0 4.0 3.5 −1.0 −0.5 −1.5*
Healthy LE 2.0 2.1 3.4 0.1 1.2* 1.3* 2.4 3.0 3.7 0.6 0.8 1.3*
Level of significance for a two-tailed test. Test for statistical significance done for healthy LE and unhealthy LE. *Significantly different at 5% level from the previous time
period. The sum of LE in health states might not add up to Total LE because of rounding, LE: Life expectancy
It is important to note that not only the absolute numbers of life expectancy and HLE increased over the period
2005–2012 for both men and women of all ages but also the proportions of life in good health did so. In 2005, an 80-year-
old South African woman could expect to live about a third of her remaining lifetime in good health. By 2012, she could
expect to live approximately half of her remaining lifetime in good health [Table 3]. On the other hand, a man of the
same age could expect to live more than a third (36.8%) of his remaining lifetime in good health in 2005 and by 2012
approximately two-thirds (61.5%) [Table 3]. It is also evident that although women lived longer than men, they spent
much of their lifetime in poor health. The standard errors of the proportions get larger with age due to the relatively
smaller sample sizes at the oldest ages.
However, the changes in TLE and HLE over the period 2005–2008 and over the period 2008–2012 were different.
Our results show that the TLE at all ages declined from 2005 to 2008 for both men and women with a reduction from 0.1
to 0.4 years and a greater reduction found at older ages, although such a decline is not statistically significant [Table 2].
Our results further show that male HLE at ages 50 and 60 declined in the period 2005–2008, while female HLE at
these ages did not decline in the same period. The reduction in male HLE caused a decrease in the proportion of life in
good health from 2005 to 2008 for age 50 by 1.4 percentage points (=66.8–68.2%) and age 60 by 4.9 percentage points
(=59.3–64.2%). However, from 2008 to 2012, no reduction in TLE, HLE, and the proportion of life in good health was
observed, and men at age 60 witnessed a more pronounced increase (by 1.3 years) in HLE, or 7.9% in 2012 than in 2008.
4. Discussion
Our focus in this study was to use a single global domain (self-rated health) from three waves of a nationally representative
cross-sectional survey in South Africa from 2005 to 2012 to investigate changes in population health in relation to
increases in TLE and to investigate the gender difference in such changes. Overall, the findings showed that the health
of older people in South Africa improved over the period under investigation with a greater improvement in women. Our
findings provide additional evidence to support the compression of morbidity (European Health Expectancy Monitoring
Unit, 2009).
The improvement in HLE in South Africa over the period 2005–2012 that we observed in this study may be partially
explained by contextual factors related to the hosting of the Federation of International Football Association (FIFA) World
Cup in 2010. The success of hosting the 2010 World Cup brought a “feel good” sensation, happiness, national pride, and
enhanced social cohesion across the country (Gibson, Walker, Thapa et al., 2014; Møller, 2014). We speculate that this
could have translated into positive responses on self-rated health and, hence, a positive trend in HLE during the period
16 International Journal of Population Studies | 2018, Volume 4, Issue 2