
Page 43 - IJPS-4-2
P. 43
Patil, et al.
(Cole, 2000), and WHO growth charts (World Health Organization, 2000).
To calculate central adiposity, the WC was used along with two indices, WHtR and WHR. In consistent with common
practice in the existing literature, for WHtR, 0.5 was used as a universal cutoff to identify centrally obese, and WHR
cutoff for boys and girls were 0.90 and 0.85, respectively (World Health Organization, 1999; Chung, Park, Park, et al.,
2016). WC was categorized using age-and sex-specific percentile. WC between the 75 and 90 percentiles was classified
th
th
as centrally overweight while above the 90 percentile as a centrally obese (Weiss, Dziura, Burgert, et al., 2004; Zimmet,
th
Alberti, Kaufman, et al., 2007; Lee, Davis, Woolford, et al., 2009; Khadilkar, Ekbote, Chiplonkar, et al., 2014).
Data were analyzed using Microsoft Excel 2013 and R Studio for Windows (version 3.5). Descriptive statistic across
study variables was presented as frequency as well as percentage. p <0.05 was considered as statistically significant. Receiver
operating characteristics (ROC) curves were drawn among IAP, IOTF, and WHO charts with central adiposity indices WHtR,
WHR, and WC. Values of the corresponding area under the curve (AUC) from ROC were used to draw an inference.
2.1. Consent
An informed consent was obtained from each of children participated in the survey.
3. Results
Among 1486 adolescents interviewed, 1349 with the valid records of all the variables under consideration were included
for the study, with 702 (52%) boys and 647 (48%) girls [Table 1]. The proportion of overweight and obese was found as
36% by IAP growth charts, 27 % by IOTF, and 25% by the WHO growth charts. Gender had no statistically significant
difference in all categories (p >0.05) [Table 2].
The prevalence of central adiposity was 26%, and 31% by WC percentile, WHtR, and WHR, respectively. The age- and
sex-specific WC percentile showed the centrally overweight as 15% and the centrally obese as 11%. For WC and WHtR,
no statistically significant difference was found in both boys and girls (p > 0.05). However, there was a gender difference
in WHR [Table 3].
In the ROC curve, the general adiposity shows a better efficacy for WC and WHtR but a poor efficacy for WHR
[Figure 1]. WC and WHtR were found to be excellent indicators of adiposity as compared to WHR. The values of AUC
for WC and WHtR were in the range of 0.857–0.927, while the corresponding values for WHR were in the range of
0.610–0.675 for all three percentile charts referred [Table 4].
4. Discussion
The BMI percentile charts referred in the present study revealed that the prevalence rates of general obesity were in the
range of 25%–35%, whereas the prevalence rates of central obesity were found in the range of 24%–31%. The higher
values of AUC in the respective ROC curve indicate that WHtR and WC are robust indicators of adiposity in the present
study population. According to the IAP growth chart, a relatively higher proportion of overweight and obese adolescents
was found. However, a higher value of the proportion of centrally obese adolescents was found in WC. WHtR seemed to
have the highest efficacy with the WHO growth charts (AUC = 0.927), whereas the poorest efficacy was seen for WHR
associated with the IOTF growth chart (AUC = 0.610). The efficacy of WHtR and its usefulness in the identification of
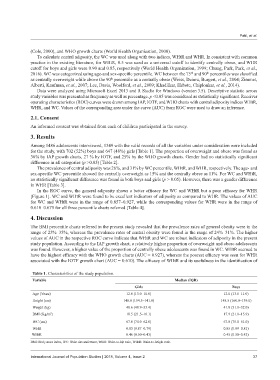
Table 1. Characteristics of the study population.
Variable Median (IQR)
Girls Boys
Age (Years) 12.0 (13.0–10.0) 12.0 (13.0–11.0)
Height (cm) 148.0 (154.5–141.0) 148.5 (160.0–139.0)
Weight (kg) 40.6 (48.9–33.4) 41.0 (51.1–32.0)
BMI (Kg/m ) 18.5 (21.5–16.1) 17.9 (21.1–15.9)
2
WC (cm) 67.0 (74.0–62.0) 67.0 (75.0–61.0)
WHR 0.83 (0.87–0.79) 0.85 (0.89–0.81)
WHtR 0.46 (0.50–0.43) 0.45 (0.50–0.42)
BMI: Body mass index, WC: Waist circumference, WHR: Waist-to-hip ratio, WHtR: Waist-to-height ratio.
International Journal of Population Studies | 2018, Volume 4, Issue 2 37