
Page 44 - IJPS-4-2
P. 44
Different obesity measures in adolescents in Mumbai
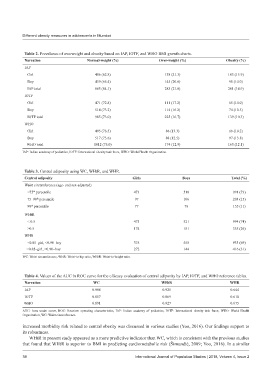
Table 2. Prevalence of overweight and obesity based on IAP, IOTF, and WHO BMI growth charts.
Narration Normal‑weight (%) Over‑weight (%) Obesity (%)
IAP
Girl 406 (62.8) 138 (21.3) 103 (15.9)
Boy 459 (65.4) 145 (20.6) 98 (14.0)
IAP total 865 (64.1) 283 (21.0) 201 (14.9)
IOTF
Girl 471 (72.8) 111 (17.2) 65 (14.0)
Boy 514 (73.2) 114 (16.2) 74 (10.5)
IOTF total 985 (73.0) 225 (16.7) 139 (10.3)
WHO
Girl 495 (76.5) 86 (13.3) 66 (10.2)
Boy 517 (73.6) 88 (12.5) 97 (13.8)
WHO total 1012 (75.0) 174 (12.9) 163 (12.1)
IAP: Indian academy of pediatrics, IOTF: International obesity task force, WHO: World Health Organization.
Table 3. Central adiposity using WC, WHtR, and WHR.
Central adiposity Girls Boys Total (%)
Waist circumference (age- and sex-adjusted)
<75 percentile 473 518 991 (73)
th
th
75–90 percentile 97 106 203 (15)
th
90 percentile 77 78 155 (11)
WHtR
< 0.5 473 521 994 (74)
≥0.5 174 181 355 (26)
WHR
<0.85–girl, <0.90–boy 375 558 933 (69)
≥0.85–girl, ≥0.90–boy 272 144 416 (31)
WC: Waist circumference, WHR: Waist-to-hip ratio, WHtR: Waist-to-height ratio.
Table 4. Values of the AUC in ROC curve for the efficacy evaluation of central adiposity by IAP, IOTF, and WHO reference tables.
Narration WC WHtR WHR
IAP 0.908 0.925 0.644
IOTF 0.857 0.869 0.610
WHO 0.891 0.927 0.675
AUC: Area under curve, ROC: Receiver operating characteristics, IAP: Indian academy of pediatrics, IOTF: International obesity task force, WHO: World Health
Organization, WC: Waist circumference.
increased morbidity risk related to central obesity was discussed in various studies (Yoo, 2016). Our findings support to
its robustness.
WHtR in present study appeared as a more predictive indicator than WC, which is consistent with the previous studies
that found that WHtR is superior to BMI in predicting cardiometabolic risk (Šimundić, 2009; Yoo, 2016). In a similar
38 International Journal of Population Studies | 2018, Volume 4, Issue 2