Page 11 - IJPS-5-1
P. 11

Van Natta M and Zimmer Z


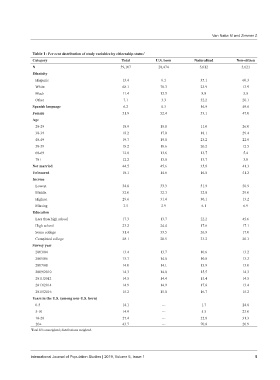
               Table 1: Per cent distribution of study variables by citizenship status 1
               Category                              Total         U.S. born        Naturalized       Non‑citizen
               N                                    39,107          28,474            5,012             5,621
               Ethnicity
                Hispanic                             13.4             6.1             35.1              60.3
                White                                68.1            78.3             23.9              13.9
                Black                                11.4            12.3              8.8               5.8
                Other                                 7.1             3.3             32.2              20.1
               Spanish language                       6.2             0.3             16.9              49.6
               Female                                51.9            52.4             53.1              47.0
               Age
                20-29                                18.9            18.8             11.0              26.0
                30-39                                18.2            17.0             18.1              29.4
                40-49                                19.7            19.0             23.2              22.9
                50-59                                18.2            18.6             20.2              12.5
                60-69                                12.8            13.6             13.7               5.4
                70+                                  12.2            13.0             13.7               3.8
               Not married                           44.5            45.6             35.8              41.3
               Uninsured                             18.1            14.6             16.8              51.2
               Income
                Lowest                               34.8            33.3             31.9              50.9
                Middle                               32.0            32.3             32.0              29.0
                Highest                              29.6            31.4             30.1              13.2
                Missing                               3.5             2.9              6.1               6.9
               Education
                Less than high school                17.3            13.7             22.2              45.6
                High school                          23.2            24.4             17.6              17.1
                Some college                         31.4            33.5             26.9              17.0
                Completed college                    28.1            28.5             33.2              20.3
               Survey year
                2003/04                              13.4            13.7             10.6              13.2
                2005/06                              13.7            14.0             10.8              13.2
                2007/08                              14.0            14.1             13.9              13.0
                2009/2010                            14.3            14.0             15.5              14.3
                2011/2012                            14.5            14.4             15.4              14.5
                2013/2014                            14.9            14.9             17.0              13.4
                2015/2016                            15.2            15.0             16.7              15.2
               Years in the U.S. (among non‑U.S. born)
                0-5                                  14.1             ---              1.7              24.8
                5-10                                 14.9             ---              5.5              23.0
                10-20                                27.4             ---             22.8              31.3
                 20+                                 43.7             ---             70.0              20.9
              1 Total N’s unweighted; distributions weighted.


              International Journal of Population Studies | 2019, Volume 5, Issue 1                           5
   6   7   8   9   10   11   12   13   14   15   16