
Page 13 - IJPS-5-1
P. 13
Van Natta M and Zimmer Z
of coefficients levels off after about age 50. This suggests that the relationship between age and SAH is not linear; a result
is consistent with other research (Rubin and Zimmer, 2015). Income and education are consequential. High education
and high income are strongly and significantly associated with a higher likelihood of rating one’s health favorably. The
opposite trend is true for low education and low income. This finding aligns with the broader literature that finds that
socioeconomic status is positively correlated with SAH (van Doorslaer, Wagstaff, Bleichrodt et al. 1997; Huisman, van
Lenthe, Mackenbach et al., 2007). Interestingly, there are some temporal differences in SAH rating in NHANES as well.
Compared to 2003/04, respondents in later years increasingly tend to rate their health significantly less favorably. Overall,
this suggests a worsening of SAH over time, an issue that is somewhat puzzling but may be important for future research.
These additional results are available from the authors on request.
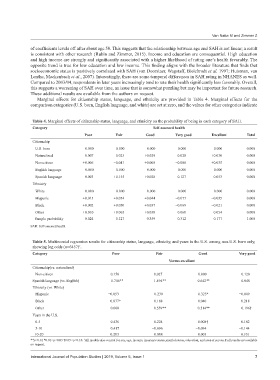
Marginal effects for citizenship status, language, and ethnicity are provided in Table 4. Marginal effects for the
comparison categories (U.S. born, English language, and white) are set at zero, and the values for other categories indicate
Table 4. Marginal effects of citizenship status, language, and ethnicity on the probability of being in each category of SAH.
Category Self‑assessed health
Poor Fair Good Very good Excellent Total
Citizenship
U.S. born 0.000 0.000 0.000 0.000 0.000 0.000
Naturalized −0.007 −0.023 +0.029 −0.028 +0.030 0.000
Non-citizen +0.006 −0.041 +0.008 −0.008 +0.035 0.000
English language 0.000 0.000 0.000 0.000 0.000 0.000
Spanish language −0.003 +0.155 +0.028 −0.127 −0.053 0.000
Ethnicity
White 0.000 0.000 0.000 0.000 0.000 0.000
Hispanic +0.015 +0.054 +0.044 −0.077 −0.035 0.000
Black +0.002 +0.050 +0.037 −0.069 −0.021 0.000
Other +0.010 +0.065 +0.038 −0.060 −0.054 0.000
Sample probability 0.024 0.127 0.359 0.312 0.177 1.000
SAH: Self-assessed health.
Table 5. Multinomial regression results for citizenship status, language, ethnicity, and years in the U.S. among non-U.S. born only,
showing log odds (n=6457) .
1
Category Poor Fair Good Very good
Versus excellent
Citizenship(vs. naturalized)
Non-citizen 0.150 0.027 0.000 0.120
Spanish language (vs. English) 0.746** 1.494** 0.642** 0.048
Ethnicity (vs. White)
Hispanic −0.053 0.239 0.325* −0.049
Black −0.877* −0.188 −0.040 −0.218
Other 0.000 0.559** 0.514** 0.196†
Years in the U.S.
0-5 0.436 −0.224 −0.008† −0.182
5-10 0.417 −0.096 −0.094 −0.144
10-20 0.203 0.008 0.003 −0.101
**p<0.01 *0.01<p<0.05 †0.05<p<0.10. All models also control for sex, age, income, insurance status, marital status, education, and year of survey. Full results are available
1
on request.
International Journal of Population Studies | 2019, Volume 5, Issue 1 7