
Page 12 - IJPS-5-1
P. 12
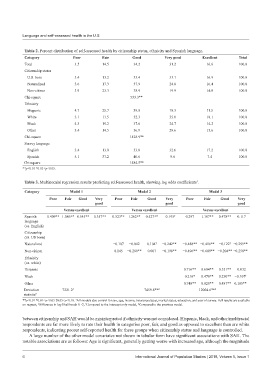
Language and self-assessed health in the U.S


           Table 2. Percent distribution of self-assessed health by citizenship status, ethnicity and Spanish language.
           Category             Poor        Fair         Good          Very good       Excellent       Total
           Total                 3.5         14.5         34.2           31.2            16.6          100.0
           Citizenship status
             U.S. born           3.4         13.2         33.4           33.1            16.9          100.0
             Naturalized         3.6         17.3         37.9           24.8            16.4          100.0
             Non-citizen         3.9         23.3         38.9           19.9            14.0          100.0
           Chi-square                                   533.3**
           Ethnicity
             Hispanic            4.7         25.7         39.8           18.3            11.5          100.0
             White               3.1         11.5         32.3           35.0            18.1          100.0
             Black               4.3         19.2         37.6           24.7            14.2          100.0
             Other               3.4         14.5         36.9           29.6            15.6          100.0
           Chi-square                                   1428.9**
           Survey language
             English             3.4         13.0         33.8           32.6            17.2          100.0
             Spanish             5.1         37.2         40.6           9.6             7.4           100.0
           Chi-square                                   1484.5**
           **p<0.01 *0.01<p<0.05.


           Table 3. Multinomial regression results predicting self-assessed health, showing log odds coefficients .
                                                                                     1
           Category            Model 1                      Model 2                       Model 3
                      Poor   Fair  Good  Very     Poor   Fair   Good   Very     Poor    Fair   Good   Very
                                         good                          good                           good
                            Versus excellent             Versus excellent              Versus excellent
           Spanish   0.409** 1.086** 0.545** −0.357**  0.523** 1.262**  0.527**  −0.195 †  0.297  1.187**  0.478**  −0.117
           language
           (vs. English)
           Citizenship
           (vs. US born)
           Naturalized                           −0.107  −0.042  0.104 †  −0.242**  −0.488** −0.416**  −0.122 −0.299**
                                                                                                   †
           Non-citizen                            0.145  −0.269**  0.007  −0.198**  −0.496** −0.609** −0.204** −0.258**
           Ethnicity
           (vs. white)
           Hispanic                                                            0.716**  0.604**  0.351**  −0.032
           Black                                                                0.216*  0.478**  0.230** −0.107 †
           Other                                                               0.748**  0.820**  0.487** 0.185**
           Deviation        7221.2 3                          7459.8** 4              12004.6** 4
           statistic 2
           **p<0.01 *0.01<p<0.05 †0.05<p<0.10.  All models also control for sex, age, income, insurance status, marital status, education, and year of survey. Full results are available
                                 1
           on request,  Difference in log-likelihoods X -2,  Compared to the intercept only model,  Compared to the previous model.
                                     3
                                                            4
                 2
           between citizenship and SAH would be misinterpreted if ethnicity was not considered. Hispanic, black, and other/multiracial
           respondents are far more likely to rate their health in categories poor, fair, and good as opposed to excellent than are white
           respondents, indicating poorer self-reported health for these groups when citizenship status and language is controlled.
             A large number of the other model covariates not shown in tabular form have significant associations with SAH. The
           notable associations are as follows: Age is significant, generally getting worse with increased age, although the magnitude


           6                                               International Journal of Population Studies | 2019, Volume 5, Issue 1