
Page 12 - IJPS-6-1
P. 12
Effects and resilience to natural disasters in rural India
3. Results
3.1. Cumulative Effects of Disasters in Odisha
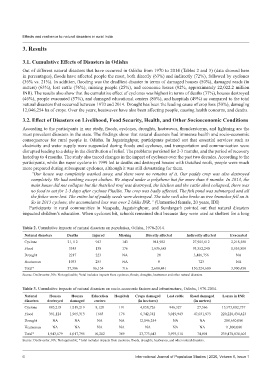
Out of different natural disasters that have occurred in Odisha from 1970 to 2014 (Tables 2 and 3) (data showed here
in percentages), floods have affected people the most, both directly (63%) and indirectly (72%), followed by cyclones
(36% vs. 21%). In addition, flooding was the deadliest disaster in terms of damaged houses (50%), damaged roads (in
meters) (63%), lost cattle (76%), missing people (25%), and economic losses (92%, approximately 22,022.2 million
INR). The results also show that the cumulative effect of cyclones was highest in terms of deaths (37%), houses destroyed
(46%), people evacuated (57%), and damaged educational centers (80%), and hospitals (49%) as compared to the total
natural disasters that occurred between 1970 and 2014. Drought has been the leading cause of crop loss (50%), damaging
12,046,254 ha of crops. Over the years, heatwaves have also been affecting people, causing health concerns, and deaths.
3.2. Effect of Disasters on Livelihood, Food Security, Health, and Other Socioeconomic Conditions
According to the participants in our study, floods, cyclones, droughts, heatwaves, thunderstorms, and lightning are the
most prevalent disasters in the state. The findings show that natural disasters had immense health and socio-economic
consequences for rural people in Odisha. In Jagatsinghpur, participants pointed out that essential services such as
electricity and water supply were suspended during floods and cyclones, and transportation and communication were
disrupted leading to a delay in the distribution of relief. The problems persisted for 2-3 months, and the period of recovery
lasted up to 4 months. The study also traced changes in the impact of cyclones over the past two decades. According to the
participants, while the super cyclone in 1999 led to deaths and destroyed houses with thatched roofs, people were much
more prepared during subsequent cyclones, although it was still devastating for them.
“Our house was completely washed away, and there were no remains of it. Our paddy crop was also destroyed
completely. We had nothing except clothes. We stayed under a polythene hut for more than 6 months. In 2013, the
main house did not collapse but the thatched roof was destroyed, the kitchen and the cattle shed collapsed, there was
no food to eat for 2-3 days after cyclone Phailin. The crop was badly affected. The fish pond was submerged and all
the fishes were lost. The entire lot of paddy seeds were destroyed. The tube well also broke as tree branches fell on it.
So in 2013 cyclone, the accumulated loss was over 2 lakhs INR.” (Unmarried female, 20 years, IDI)
Participants in rural communities in Nuapada, Jagatsinghpur, and Sundargarh pointed out that natural disasters
impacted children’s education. When cyclones hit, schools remained shut because they were used as shelters for a long
Table 2. Cumulative impacts of natural disasters on population, Odisha, 1970-2014.
Natural disasters Deaths Injured Missing Directly affected Indirectly affected Evacuated
Cyclone 21,112 943 143 941,902 27,905,612 2,218,588
Flood 3545 138 176 1,636,685 93,352,240 1,555,800
Drought 2217 223 NA 20 3,486,756 NA
Heatwaves 1033 285 NA 0 723 NA
Total* 57,306 86,154 716 2,600,441 130,524,600 3,900,450
Source: DesInventar; NA: Not applicable; *total includes impacts from cyclones, floods, droughts, heatwaves and other natural disasters.
Table 3. Cumulative impacts of natural disasters on socio-economic factors and infrastructure, Odisha, 1970-2014.
Natural Houses Houses Education Hospitals Crops damaged Lost cattle Road damaged Losses in INR
disasters destroyed damaged centers (in hectares) (in meters)
Cyclone 885,218 1,919,219 8,128 191 4,050,726 946,327 27,366 13,973,002,737
Flood 391,124 1,965,313 1683 178 6,742,742 3,019,943 47,031,973 220,220,434,423
Drought NA NA NA NA 12,046,254 NA NA 288,650,000
Heatwaves NA NA NA NA NA NA NA 11,800,000
Total* 1,943,679 4,017,795 10,202 389 23,773,643 3,993,510 74,801 239,470,830,605
Source: DesInventar; NA: Not applicable; * total includes impacts from cyclones, floods, droughts, heatwaves, and other natural disasters.
6 International Journal of Population Studies | 2020, Volume 6, Issue 1