
Page 50 - IJPS-7-1
P. 50
Food insecurity and social support in Brazil
Logistic regression models were used to estimate crude and adjusted odds ratios (OR) and respective 95% confidence
intervals (CI). Sociodemographic covariates that presented P < 0.20 in the unadjusted analysis were incorporated into the
adjusted analysis. In the final model, all the social support dimensions and the sociodemographic covariates with P < 0.05
were maintained. Statistical significance was set at P < 0.05.
3. Results
Among the 598 participants, 42.3% were classified as having food insecurity and 76.8% had a family income equivalent
to more than two minimum wages. Food insecurity was more prevalent among women (45.0%), those of African
American ethnicity (49.0%), and among those with a family income equal to or less than two minimum wages (56.1%).
No significant differences were observed in the first analysis with respect to age, marital status, whether the older adults
worked, and whether they were the head of their household.
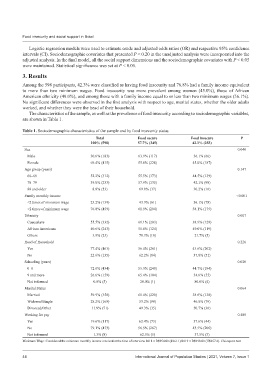
The characteristics of the sample, as well as the prevalence of food insecurity according to sociodemographic variables,
are shown in Table 1.
Table 1. Sociodemographic characteristics of the sample and by food insecurity status.
Total Food secure Food insecure P
100% (598) 57.7% (345) 42.3% (253)
Sex 0.040
Male 30.6% (183) 63.9% (117) 36.1% (66)
Female 69.4% (415) 55.0% (228) 45.0% (187)
Age group (years) 0.147
60–69 52.2% (312) 55.5% (173) 44.5% (139)
70–79 39.0% (233) 57.9% (135) 42.1% (98)
80 and older 8.8% (53) 69.8% (37) 30.2% (16)
Family monthly income <0.001
≤2 times of minimum wage 23.2% (139) 43.9% (61) 56.1% (78)
>2 times of minimum wage 76.8% (459) 61.9% (284) 38.1% (175)
Ethnicity 0.007
Caucasians 55.5% (332) 61.1% (203) 38.9% (129)
African Americans 40.6% (243) 51.0% (124) 49.0% (119)
Others 3.9% (23) 78.3% (18) 21.7% (5)
Head of Household 0.226
Yes 77.4% (463) 56.4% (261) 43.6% (202)
No 22.6% (135) 62.2% (84) 37.8% (51)
Schooling (years) 0.020
0–8 72.6% (434) 55.3% (240) 44.7% (194)
9 and more 26.6% (159) 65.4% (104) 34.6% (55)
Not informed 0.8% (5) 20.0% (1) 80.0% (4)
Marital Status 0.064
Married 59.9% (358) 61.4% (220) 38.6% (138)
Widowed/Single 28.2% (169) 53.2% (90) 46.8% (79)
Divorced/Other 11.9% (71) 49.3% (35) 50.7% (36)
Working for pay 0.488
Yes 19.6% (117) 62.4% (73) 37.6% (44)
No 79.1% (473) 56.5% (267) 43.5% (206)
Not informed 1.3% (8) 62.5% (5) 37.5% (3)
Minimum Wage: Considered the minimum monthly income received at the time of interview 2018 = R$954.00 ($261.1)/2019 = R$998.00 (U$257.2). Chi-square test
44 International Journal of Population Studies | 2021, Volume 7, Issue 1