
Page 51 - IJPS-7-1
P. 51
Freiria et al.
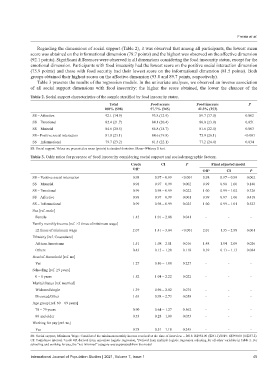
Regarding the dimensions of social support (Table 2), it was observed that among all participants, the lowest mean
score was obtained on the informational dimension (79.7 points) and the highest was observed on the affective dimension
(92.1 points). Significant differences were observed in all dimensions considering the food insecurity status, except for the
emotional dimension. Participants with food insecurity had the lowest score on the positive social interaction dimension
(75.9 points) and those with food security had their lowest score on the informational dimension (81.5 points). Both
groups obtained their highest scores on the affective dimension (93.8 and 89.7 points, respectively).
Table 3 presents the results of the regression models. In the univariate analyses, we observed an inverse association
of all social support dimensions with food insecurity: the higher the score obtained, the lower the chances of the
Table 2. Social support characteristics of the sample stratified by food insecurity status.
Total Food secure Food insecure P
100% (598) 57.7% (345) 42.3% (253)
SS – Affective 92.1 (14.9) 93.8 (12.9) 89.7 (17.0) 0.002
SS – Emotional 82.4 (21.7) 84.1 (20.4) 80.0 (23.0) 0.051
SS – Material 84.6 (20.5) 86.8 (18.7) 81.6 (22.4) 0.003
SS – Positive social interaction 81.0 (23.1) 84.6 (19.8) 75.9 (26.1) <0.001
SS – Informational 79.7 (23.2) 81.5 (22.1) 77.2 (24.4) 0.034
SS: Social support. Values are presented as mean (points) ± standard deviation. Mann–Whitney U test.
Table 3. Odds ratios for presence of food insecurity considering social support and sociodemographic factors.
Crude CI P Final adjusted model
OR a OR b CI P
SS – Positive social interaction 0.98 0.97 – 0.99 <0.001 0.98 0.97 – 0.99 0.002
SS – Material 0.98 0.97 – 0.99 0.002 0.99 0.98 – 1.00 0.140
SS – Emotional 0.99 0.98 – 0.99 0.022 1.00 0.99 – 1.02 0.326
SS – Affective 0.98 0.97 – 0.99 0.001 0.99 0.97 – 1.00 0.418
SS – Informational 0.99 0.98 – 0.99 0.025 1.00 0.99 – 1.01 0.523
Sex [ref. male]
Female 1.45 1.01 – 2.08 0.041 - - -
Family monthly income [ref. >2 times of minimum wage]
≤2 times of minimum wage 2.07 1.41 – 3.04 <0.001 2.01 1.35 – 2.98 0.001
Ethnicity [ref. Caucasians]
African Americans 1.51 1.08 – 2.11 0.016 1.48 1.04 – 2.09 0.026
Others 0.43 0.15 – 1.20 0.110 0.39 0.13 – 1.13 0.084
Head of Household [ref. no]
Yes 1.27 0.86 – 1.88 0.227 - - -
Schooling [ref. ≥9 years]
0 – 8 years 1.52 1.04 – 2.22 0.022 - - -
Marital Status [ref. married]
Widowed/single 1.39 0.96 – 2.02 0.075 - - -
Divorced/Other 1.63 0.98 – 2.73 0.058 - - -
Age group [ref. 60 – 69 years]
70 – 79 years 0.90 0.64 – 1.27 0.562 - - -
80 and older 0.53 0.28 – 1.00 0.053 - - -
Working for pay [ref. no]
Yes 0.78 0.51 – 1.18 0.245 - - -
SS: Social support; Minimum Wage: Considered the minimum monthly income received at the time of interview = 2018: R$954.00 ($261.1)/2019: R$998.00 (U$257.2).
CI: Confidence interval. crude OR derived from univariate logistic regression, Derived from multiple logistic regression adjusting for all other variables in Table 1. For
b
a
schooling and working for pay, the “not informed” category was suppressed from the model
International Journal of Population Studies | 2021, Volume 7, Issue 1 45