
Page 71 - IJPS-9-2
P. 71
International Journal of
Population Studies Relationship between population aging and innovativeness
data were derived from the Barro-Lee dataset. The dataset commercial ones. However, as mentioned in the previous
covered 38 countries over the 1985 – 2019 period. The section, given the potential threat of population aging to
data were divided into non-overlapping 5-year intervals technological progress, this variable allows for a precise
to ensure comparability between the data provided by examination of the relationship between population aging
the United Nations (grouped by 5-year intervals) and the and technological progress is crucial driver of economic
annual data on patent applications per resident provided development.
by the World Bank. Table 1 provides the definition and the The countries included in the analysis were selected
source of each variable used in the subsequent analyses. based on data availability to ensure the longest possible
Patent applications per 1000 inhabitants will be used as the observational period. These countries (and regions)
variable to gauge each country’s level of innovation effort include: Austria, Bangladesh, Belgium, Bulgaria, Brazil,
in this study. Smith (2005) has discussed the pros and cons Canada, Chile, China, Hong Kong (China), Costa
of using this variable as a proxy of innovation. The most Rica, Denmark, Finland, France, Germany, Greece,
evident limitation of using this variable is that patents Guatemala, India, Iceland, Israel, Japan, Republic of
mainly reflect technological innovations rather than Korea, Malaysia, Mexico, Netherlands, New Zealand,
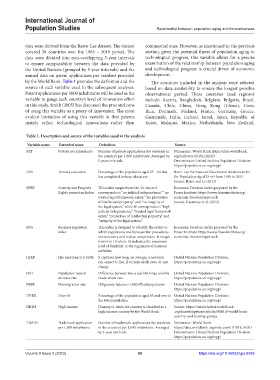
Table 1. Description and source of the variables used in the analysis
Variable name Extended name Definition Source
PAT Patents per inhabitants Number of patents applications (by residents in Numerator: World Bank: https://data.worldbank.
the country) per 1,000 inhabitants. Averaged by org/indicator/IP.PAT.RESD
5 years intervals. Denominator: United Nations Population Division:
https://population.un.org/wpp/
UNI Tertiary education Percentage of the population aged 25 – 64 that Barro-Lee Estimates of Educational Attainment for
has completed tertiary education the Population Aged 25–64 from 1950 to 2015
Source: Barro and Le (2013)
SPRP Security and Property This index ranges from 0 to 10, where 0 Economic Freedom Index proposed by the
Rights protection Index corresponds to “no judicial independence,” “no Fraser Institute: https://www.fraserinstitute.org/
trusted legal framework exists,” “no protection economic-freedom/approach
of intellectual property,” and “no integrity of Source: Gwartney et al. (2019)
the legal system,” while 10 corresponds to “high
judicial independence,” “trusted legal framework
exists,” “protection of intellectual property,” and
“integrity of the legal system.”
BUS Business regulation This index is designed to identify the extent to Economic Freedom Index proposed by the
index which regulations and bureaucratic procedures Fraser Institute: https://www.fraserinstitute.org/
restrain entry and reduce competition. It ranges economic-freedom/approach
from 0 to 10 where 10 indicates the maximum
level of flexibility in the regulation of business
activities.
LEXP Life expectancy at birth It captures how long, on average, a newborn United Nations Population Division:
can expect to live, if current death rates do not https://population.un.org/wpp/
change
NAT Population natural Difference between the crude birth rate and the United Nations Population Division:
increase rate crude death rate. https://population.un.org/wpp/
NMR Net migration rate (Migratory balance×1,000)/Total population United Nations Population Division:
https://population.un.org/wpp/
OVER Over 65 Percentage of the population aged 65 and over in United Nations Population Division:
the total population https://population.un.org/wpp/
HIGH High income Dummy=1 when the country is classified as a Source: https://datahelpdesk.worldbank
high income country by the World Bank .org/knowledgebase/articles/906519-world-bank-
country-and-lending-groups
TRADE Trademark application Number of trademark applications (by residents Numerator: World Bank:
per 1,000 inhabitants in the country) per 1,000 inhabitants. Averaged https://data.worldbank.org/indicator/IP.TMK.RESD
by 5-year intervals. Denominator: United Nations Population Division:
https://population.un.org/wpp/
Volume 9 Issue 2 (2023) 65 https://doi.org/10.36922/ijps.0429