Page 74 - IJPS-9-2
P. 74

International Journal of
            Population Studies                                      Relationship between population aging and innovativeness


                                                                                             JPN
                                                                                             PRT
                                                                                             FIN
                                                                                             GRC
                                                                                             DEU
                                                                                             BGR
                                                                                             FRA
                                                                                             SWE
                                                                                             DNK
                                                                                             ESP
                                                                                             NLD
                                                                                             AUT
                                                                                             BEL
                                                                                             CHE
                                                                                             ROU
                                                                                             GBR
                                                                                             POL
                                                                                             CAN
                                                                                             HKG
                                                                                             NOR
                                                                                             USA
                                                                                             NZL
                                                                                             ISL
                                                                                             KOR
                                                                                             THA
                                                                                             ISR
                                                                                             CHL
                                                                                             CHN
                                                                                             CRI
                                                                                             BRA
                                                                                             TUR
                                                                                             MEX
                                                                                             MYS
                                                                                             IND
                                                                                             ZAF
                                                                                             PHL
                                                                                             BGD
                                                                                             GTM
                         0          5         10          15         20         25         30
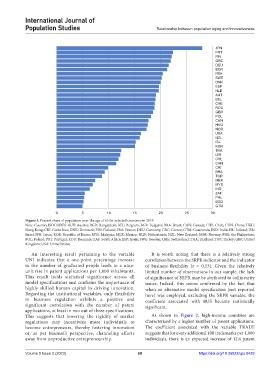
            Figure 3. Percent share of population over the age of 65 for selected countries in 2019
            Note: Country ISOCODES: AUT: Austria; BGD: Bangladesh; BEL: Belgium; BGR: Bulgaria; BRA: Brazil; CAN: Canada; CHL: Chile; CHN: China; HKG:
            Hong Kong; CRI: Costa Rica; DNK: Denmark; FIN: Finland; FRA: France; DEU: Germany; GRC: Greece; GTM: Guatemala; IND: India; ISL: Iceland; ISR:
            Israel; JPN: Japan; KOR: Republic of Korea; MYS: Malaysia; MEX: Mexico; NLD: Netherlands; NZL: New Zealand; NOR: Norway; PHL: the Philippines;
            POL: Poland; PRT: Portugal; ROU: Romania: ZAF: South Africa; ESP: Spain; SWE: Sweden; CHE: Switzerland; THA: Thailand; TUR: Turkey; GBR: United
            Kingdom; USA: United States.

              An interesting result pertaining to the variable   It is worth noting that there is a relatively strong
            UNI indicates that a one-point percentage increase   correlation between the SRPR indicator and the indicator
            in the number of graduated people leads to a nine-  of business flexibility (r = 0.53). Given the relatively
            unit rise in patent applications per 1,000 inhabitants.   limited number of observations in our sample, the lack
            This result holds statistical significance across all   of significance of SRPR may be attributed to collinearity
            model specifications and confirms the importance of   issues. Indeed, this seems confirmed by the fact that
            highly skilled human capital in driving innovation.   when an alternative model specification (not reported
            Regarding the institutional variables, only flexibility   here) was employed, excluding the SRPR variable, the
            in  business  regulation  exhibits a  positive  and   coefficient associated with BUS became statistically
            significant correlation with the number of patent   significant.
            applications, at least in two out of three specifications.
            This suggests that lowering the rigidity of market   As shown in  Figure  2, high-income countries are
            regulations  may  incentivize  more  individuals  to   characterized by a higher number of patent applications.
            become entrepreneurs, thereby fostering innovation   The coefficient associated with the variable TRADE
            or,  as per Baumol’s  perspective,  channeling efforts   suggests that for every additional 100 trademarks per 1,000
            away from unproductive entrepreneurship.           individuals, there is an expected increase of 12.6 patent


            Volume 9 Issue 2 (2023)                         68                        https://doi.org/10.36922/ijps.0429
   69   70   71   72   73   74   75   76   77   78   79