
Page 75 - IJPS-9-2
P. 75
International Journal of
Population Studies Relationship between population aging and innovativeness
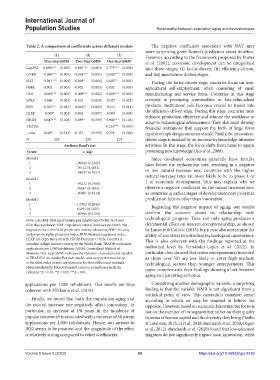
Table 2. A comparison of coefficients across different models The negative coefficient associated with NAT may
seem surprising given Romer’s prediction about its effect.
(1) (2) (3) However, according to the framework proposed by Porter
One-step GMM Two-Step GMM One-step GMM’ et al. (2002), economic development can be categorized
Lag.PAT 0.890*** (0.035) 0.892*** (0.063) 0.775*** (0.038) into three stages: (i) factor-driven, (ii) efficiency-driven,
OVER -0.058*** (0.005) -0.054*** (0.011) -0.044*** (0.004) and (iii) innovation-driven stages.
NAT -0.011*** (0.004) -0.008* (0.004) -0.007** (0.003) During the factor-driven stage, countries focus on non-
NMR -0.002 (0.003) -0.002 (0.003) -0.002 (0.003) agricultural self-employment, often consisting of small
UNI 0.009*** (0.002) 0.009*** (0.002) 0.008*** (0.002) manufacturing and service firms. Countries in this stage
SPRP -0.006 (0.022) -0.010 (0.026) 0.027 (0.021) compete in producing commodities or low-value-added
BUS 0.027** (0.011) 0.024** (0.012) 0.011 (0.011) products. Institutions’ role becomes crucial to transit into
LEXP 0.008* (0.004) 0.006 (0.007) 0.000 (0.004) the efficiency-driven stage. During this stage, countries must
enhance production efficiency and educate the workforce to
HIGH 0.647*** (0.106) 0.699* (0.359) 0.940*** (0.103) adapt to technological advancement. They also must develop
TRADE 0.126*** (0.030) financial institutions that support the birth of large firms
_cons -0.439 (0.313) -0.351 (0.593) -0.371 (0.284) capable of exploiting economies of scale. Finally, the innovation-
N 228 228 219 driven stage is marked by an increase in knowledge-intensive
Arellano Bond’s test activities. In this stage, the focus shifts from firms to agents
Order z (sig) possessing new knowledge (Acs et al., 2008).
Model 1 Since developed economies generally have fertility
1 -.99349 (0.3205) rates below the replacement rate, resulting in a negative
2 .70122 (0.4832) or low natural increase rate, countries with the higher
3 -.84927 (0.3957)
Model 2 natural increase rates are more likely to be in phase 1 or
2 of economic development. This may explain why we
1 -.94232 (0.3460)
2 .70087 (0.4834) observe a negative coefficient for the natural increase rate,
3 -.80401 (0.4214) as countries in earlier stages of development may prioritize
Model 3 production factors other than innovation.
1 -1.0702 (0.2845) Regarding the negative impact of aging, our results
2 .63955 (0.5225)
3 -.80996 (0.4180) confirm the concern about its relationship with
Note: LAG.PAT: first lag of Patents per inhabitants; OVER: % of over technological progress. Thus, not only aging produces a
65 in the population; NAT: Population natural increase rate; NMR: Net detrimental effect on nascent entrepreneurship, as shown
migration rate; UNI: % of people with tertiary education; SPRP: Security by Lamotte & Colovic (2013), but it may also undermine the
and property rights protection Index; BUS: Business regulation index; ability of countries to introduce technological innovations.
LEXP: life expectancy at birth; HIGH: Dummy =1 if the Country is This is also coherent with the findings reported at the
classified as high income country by the World Bank; TRADE: trademark
applications per 1,000 inhabitants. GMM: Generalized Method of individual level by Fernández-Lopez et al. (2022). In
Moment. One-step GMM’, indicates the inclusion of an additional variable particular, they showed that senior entrepreneurs (intended
of TRADE in the model. For each model, tests were performed for up as those over 50) are less likely to enter high-medium
to the third order of auto-correlation in the first differenced residuals. technological sectors than younger entrepreneurs. This
Heteroskedasticity Robust Standard errors in parentheses in all the paper complements their findings showing a link between
columns; *p < 0.10, **p < 0.05, ***p < 0.01.
aging and patenting activities.
applications per 1,000 inhabitants. Our results are thus Considering another demographic variable, a surprising
coherent with Flikkema et al. (2019). finding is that the variable NMR is not significant from a
statistical point of view. This contradicts common sense,
Finally, we found that both the population aging and according to which we may be tempted to believe the
the natural increase rate negatively affect innovation. In opposite. However, based on economic literature, the focus is
particular, an increase of 1% point in the incidence of not on the number of immigrants but rather on their quality
population over 65 is associated with a decrease of 58 patent in terms of human capital and the diversity they bring (Fairlie
applications per 1,000 inhabitants. Hence, our answer to & Lofstrom, 2015; Li et al., 2018; Burchardi et al., 2020; Ozgen
RQ2 seems to be positive, and the magnitude of the effect et al., 2012). Burchardi et al. (2020) found that low-educated
is relatively strong compared to other coefficients. migrants do not significantly impact local innovation, while
Volume 9 Issue 2 (2023) 69 https://doi.org/10.36922/ijps.0429