
Page 89 - ITPS-7-2
P. 89
INNOSC Theranostics and
Pharmacological Sciences Sujok therapy for patients with respiratory problems
Table 1. The respondents’ age, gender, and job status (n=30)
Variable Frequency Intervention Control Sig
group group (2‑tailed)
n % n % n %
Age 0.336
21 – 30 1 1.7 - - 1 3.3
31 – 40 3 5.0 1 3.3 2 6.7
41 – 50 9 15.0 4 13.3 5 16.7
51 – 60 19 31.6 9 30.0 10 33.3
61 – 70 23 38.3 14 46.7 9 30.0
71 – 80 4 6.7 2 6.7 2 6.7
81 – 90 1 1.7 - - 1 3.3
Gender 0.605
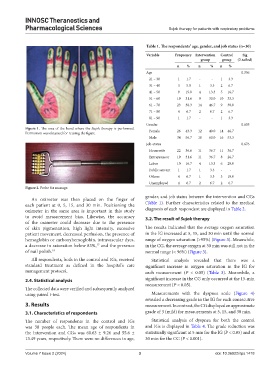
Figure 1. The area of the hand where the Sujok therapy is performed. Female 26 43.3 12 40.0 14 46.7
Permission was obtained for reusing the figure.
Male 34 56.7 18 60.0 16 53.3
Job-status 0.676
Housewife 22 36.6 11 36.7 11 36.7
Entrepreneur 19 31.6 11 36.7 8 26.7
Labor 10 16.7 4 13.3 6 20.0
Public servant 1 1.7 1 3.3 - -
Others 4 6.7 1 3.3 3 10.0
Unemployed 4 6.7 2 6.7 2 6.7
Figure 2. Probe for massage.
gender, and job status between the intervention and CGs
An oximeter was then placed on the finger of
each patient at 0, 5, 15, and 30 min. Positioning the (Table 1). Further characteristics related to the medical
oximeter in the same area is important in this study diagnosis of each respondent are displayed in Table 2.
to avoid measurement bias. Likewise, the accuracy 3.2. The result of Sujok therapy
of the oximeter could decrease due to the presence
of skin pigmentation, high light intensity, excessive The results indicated that the average oxygen saturation
patient movement, decreased perfusion, the presence of in the IG increased at 5, 15, and 30 min until the normal
hemoglobin or carboxyhemoglobin, intravascular dyes, range of oxygen saturation (>95%) (Figure 3). Meanwhile,
a decrease in saturation below 83%, and the presence in the CG, the average oxygen at 30 min was still not in the
17
of nail polish. 18 normal range (< 96%) (Figure 3).
All respondents, both in the control and IGs, received Statistical analysis revealed that there was a
standard treatment as defined in the hospital’s care significant increase in oxygen saturation in the IG for
management protocol. each measurement (P < 0.05) (Table 3). Meanwhile, a
2.4. Statistical analysis significant increase in the CG only occurred at the 15-min
measurement (P < 0.05).
The collected data were verified and subsequently analyzed
using paired t-test. Measurements with the dyspnea scale (Figure 4)
revealed a decreasing grade in the IG for each consecutive
3. Results measurement. In contrast, the CG displayed an approximate
3.1. Characteristics of respondents grade of 3 (mild) for measurements at 5, 15, and 30 min.
The number of respondents in the control and IGs Statistical analysis of dyspnea for both the control
was 30 people each. The mean age of respondents in and IGs is displayed in Table 4. The grade reduction was
the intervention and CGs was 60.63 ± 9.26 and 55.6 ± statistically significant at 5 min for the IG (P < 0.05) and at
13.49 years, respectively. There were no differences in age, 30 min for the CG (P < 0.001).
Volume 7 Issue 2 (2024) 3 doi: 10.36922/itps.1418