
Page 91 - ITPS-7-2
P. 91
INNOSC Theranostics and
Pharmacological Sciences Sujok therapy for patients with respiratory problems
This research observed that most respondents in the IG (5 min) than in the CG (30 min). Although both
(approximately 84%) had heart- and/or lung-related groups exhibited a significant decrease, the average severity
problems, which was consistent with the results of a of dyspnea symptoms in the IG was lower at grade 2 (mild),
systematic review involving 10 longitudinal studies that while the CG was at grade 3 (moderate). Notwithstanding,
stated the involvement of dyspnea in heart and lung the Likert scale measurement was considered subjective
problems. Another study stated that asthma, COPD, because variations in sensation and intensity were noted in
19
heart failure, pneumonia, and coronary arteries were the patient reports. 14
among the 85% most common causes of dyspnea. Severe Therefore, dyspnea was subsequently measured
4
dyspnea also occurs in patients with lung cancer. 9 objectively with an oximeter. The oximeter has a
Our results displayed a statistically significant decrease sensitivity of 92% and a specificity of 90% when detecting
20
in the dyspnea scale for both the CG and IGs. However, hypoxia with a 92% oxygen saturation limit. Notably,
the statistically significant decrease occurred more rapidly dyspnea is also one of the symptoms that indicate
the presence of hypoxemia. A recent study reported
that dyspnea is not implicated in all hypoxemia, and
this type of hypoxemia is called “silent hypoxemia”.
21
Oxygen saturation is often considered a fifth vital
17
sign measurement. Oxygen saturation is considered
abnormal if it is <95%, while other references indicated
22
that normal oxygen saturation ranges around 96 – 100%
at sea level. 23
Meanwhile, another reference stated that hypoxemia is
defined by oxygen saturation of less than 90%. For more
23
severe conditions, cyanosis, a form of hypoxemia, may
occur when the oxygen saturation decreases to 67%, but
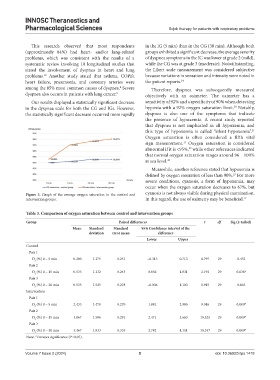
Figure 3. Graph of the average oxygen saturation in the control and cyanosis is not always visible during physical examination.
intervention groups. In this regard, the use of oximetry may be beneficial. 17
Table 3. Comparison of oxygen saturation between control and intervention groups
Group Paired differences t df Sig (2‑tailed)
Mean Standard Standard 95% Confidence interval of the
deviation error mean difference
Lower Upper
Control
Pair 1
O (%) 0 – 5 min 0.200 1.375 0.251 −0.313 0.713 0.797 29 0.432
2
Pair 2
O (%) 0 – 15 min 0.533 1.332 0.243 0.036 1.031 2.193 29 0.036*
2
Pair 3
O (%) 0 – 30 min 0.533 1.525 0.278 −0.036 1.103 1.915 29 0.065
2
Intervention
Pair 1
O (%) 0 – 5 min 2.433 1.478 0.270 1.881 2.985 9.016 29 0.000*
2
Pair 2
O (%) 0 – 15 min 3.067 1.596 0.291 2.471 3.663 10.525 29 0.000*
2
Pair 3
O (%) 0 – 30 min 3.467 1.833 0.335 2.782 4.151 10.357 29 0.000*
2
Note: *Denotes significance (P<0.05).
Volume 7 Issue 2 (2024) 5 doi: 10.36922/itps.1418