
Page 92 - ITPS-7-2
P. 92
INNOSC Theranostics and
Pharmacological Sciences Sujok therapy for patients with respiratory problems
In the present study, the oxygen saturation of the IG estimated value of oxygen saturation is based on the type
increased and reached the normal range after 30 min. In of instrument used to measure. 21
contrast, the oxygen saturation remained below the normal In addition, there were no patients with oxygen
range after 30 min for the CG. The results demonstrated saturation below 83%, which validated the accuracy of
that Sujok rapidly increased oxygen saturation, as evidenced the oximeter because inaccurate oximeter readings may
5 min after the first measurement or 2 min after completion typically indicate oxygen saturation below 83%. Other
17
of therapy in the IG. Therefore, despite the subjective references have also reported that pulse oximeter readings
assessment of dyspnea by the patient, the increase in oxygen of 70% may not be accurate as compared to the gold
saturation as measured by the oximeter was an objective standard of using blood gas measurements. 23
measurement and provided strong evidence that Sujok
therapy can increase oxygen saturation in a short time. Other studies have investigated the use of fan therapy
to reduce dyspnea symptoms. 27,28 Fan therapy is applied
However, there was also the possibility of errors directly at the feet and face, but it was reported to only
when reading the oximeter. For example, the presence of lower the dyspnea score to baseline with no reduction in
pigmentation or nail polish where the oximeter is installed dyspnea after 60 min of therapy. Another similar study
could lower the oximeter reading, which corresponds involved a larger sample of 20 patients who underwent
to a decreased oxygen saturation. 24-26 To prevent this, fan therapy to the face or feet for 5 min. The results
we placed the oximeter on the same finger and used revealed that the reduction in dyspnea was significantly
the same instrument as earlier literature stated that the higher in fan-to-face than in fan-to-leg therapy. Although
both treatment methods reported improvements on the
dyspnea scale, there was no significant difference between
the SpO (peripheral oxygen saturation levels) before and
2
after treatment. Notably, SpO measurements may have
28
2
higher values in the presence of bias in the data collected
from the respondents.
Another recent study stated that the duration of
fan therapy is generally 5 min. Although as many as
six studies (60%) reported improvements in dyspnea
symptoms with fan therapy, results from fan therapy were
considered subjective data from patients and not objective
measurements (e.g., SpO measurements through blood
2
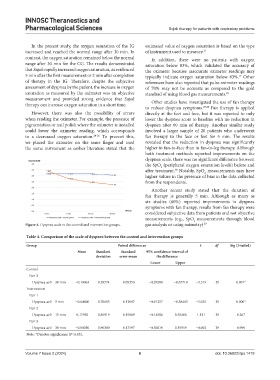
Figure 4. Dyspnea scale in the control and intervention groups. gas analysis or using oximetry) 29
.
Table 4. Comparison of the scale of dyspnea between the control and intervention groups
Group Paired differences t df Sig (2‑tailed)
Mean Standard Standard 95% confidence interval of
deviation error mean the difference
Lower Upper
Control
Pair 3
Dyspnea at 0 – 30 min −0.18463 0.28774 0.05253 −0.29208 −0.07719 −3.515 29 0.001*
Intervention
Pair 1
Dyspnea at 0 – 5 min −0.64860 0.70693 0.12907 −0.91257 −0.38463 −5.025 29 0.000*
Pair 2
Dyspnea at 0 – 15 min 0.17950 0.86919 0.15869 −0.14506 0.50406 1.131 29 0.267
Pair 3
Dyspnea at 0 – 30 min −0.00030 0.96380 0.17597 −0.36019 0.35959 −0.002 29 0.999
Note: *Denotes significance (P<0.05).
Volume 7 Issue 2 (2024) 6 doi: 10.36922/itps.1418