
Page 73 - JCAU-5-3
P. 73
Journal of Chinese
Architecture and Urbanism Spatial scale plasticity of urban residential areas
Figure 3. Path of analysis. Source: Diagram by the authors
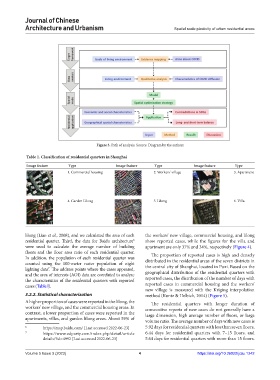
Table 1. Classification of residential quarters in Shanghai
Image feature Type Image feature Type Image feature Type
1. Commercial housing 2. Workers’ village 3. Apartment
4. Garden Lilong 5. Lilong 6. Villa
lilong (Liao et al., 2008), and we calculated the area of each the workers’ new village, commercial housing, and lilong
residential quarter. Third, the data for Baidu architecture show reported cases, while the figures for the villa and
6
were used to calculate the average number of building apartment are only 37% and 34%, respectively (Figure 4).
floors and the floor area ratio of each residential quarter. The proportion of reported cases is high and densely
In addition, the population of each residential quarter was
counted using the 100-meter raster population of night distributed in the residential areas of the seven districts in
lighting data . The address points where the cases appeared, the central city of Shanghai, located in Puxi. Based on the
7
and the area of interests (AOI) data are correlated to analyze geographical distribution of the residential quarters with
the characteristics of the residential quarters with reported reported cases, the distribution of the number of days with
cases (Table l). reported cases in commercial housing and the workers’
new village is measured with the Kriging interpolation
3.2.2. Statistical characterization method (Kuntz & Helbich, 2014) (Figure 5).
A higher proportion of cases were reported in the lilong, the The residential quarters with longer duration of
workers’ new village, and the commercial housing areas. In consecutive reports of new cases do not generally have a
contrast, a lower proportion of cases were reported in the large dimension, high average number of floors, or large
apartments, villas, and garden lilong areas. About 59% of
volume ratio. The average number of days with new cases is
6 https://map.baidu.com/ [Last accessed 2022-06-23] 5.92 days for residential quarters with less than seven floors,
7 https://www.udparty.com/index.php/detail/article 6.44 days for residential quarters with 7–15 floors, and
details/?id=4992 [Last accessed 2022-06-23] 5.64 days for residential quarters with more than 15 floors.
Volume 5 Issue 3 (2023) 4 https://doi.org/10.36922/jcau.1242