
Page 38 - JCAU-6-1
P. 38
Journal of Chinese
Architecture and Urbanism Perception of pedestrian environment
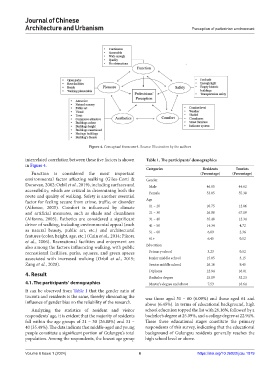
Figure 4. Conceptual framework. Source: Illustration by the authors
interrelated correlation between these five factors is shown Table 1. The participants’ demographics
in Figure 4.
Categories Residents Tourists
Function is considered the most important (Percentage) (Percentage)
environmental factor affecting walking (Giles-Corti & Gender
Donovan, 2002; Ozbil et al., 2019), including surfaces and Male 46.95 44.62
accessibility, which are critical in determining both the Female 53.05 55.38
route and quality of walking. Safety is another essential
factor for feeling secure from crime, traffic, or disorder Age
(Alfonzo, 2005). Comfort is influenced by climate 11 – 20 10.75 12.86
and artificial measures, such as shade and cleanliness 21 – 30 26.88 67.19
(Alfonzo, 2005). Esthetics are considered a significant 31 – 40 35.48 12.34
driver of walking, including environmental appeal (such 41 – 50 14.34 4.72
as natural beauty, public art, etc.) and architectural 51 – 60 6.09 2.36
features (color, height, age, etc.) (Cain et al., 2014; Pikora 61+ 6.45 0.52
et al., 2006). Recreational facilities and enjoyment are
also among the factors influencing walking, with public Education
recreational facilities, parks, squares, and green spaces Primary school 3.23 0.52
associated with increased walking (Ozbil et al., 2019; Junior middle school 15.05 3.15
Zang et al., 2020). Senior middle school 26.16 9.45
Diploma 22.94 16.01
4. Result
Bachelor degree 25.09 52.23
4.1. The participants’ demographics Master’s degree and above 7.53 18.64
It can be observed from Table 1 that the gender ratio of
tourists and residents is the same, thereby eliminating the was those aged 51 – 60 (6.09%) and those aged 61 and
influence of gender bias on the reliability of the research. above (6.45%). In terms of educational background, high
Analyzing the statistics of resident and visitor school education topped the list with 26.16%, followed by a
respondents’ age, it is evident that the majority of residents bachelor’s degree at 25.09%, and a college degree at 22.94%.
fall within the age groups of 21 – 30 (26.88%) and 31 – These three educational stages constitute the primary
40 (35.48%). The data indicate that middle-aged and young respondents of this survey, indicating that the educational
people constitute a significant portion of Gulangyu’s total background of Gulangyu residents generally reaches the
population. Among the respondents, the lowest age group high school level or above.
Volume 6 Issue 1 (2024) 6 https://doi.org/10.36922/jcau.1879