
Page 99 - JCAU-6-3
P. 99
Journal of Chinese
Architecture and Urbanism Influence of land-use change on carbon storage
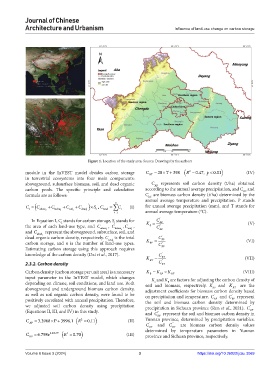
Figure 1. Location of the study area. Source: Drawings by the authors
module in the InVEST model divides carbon storage C BT 28 T 398 R 2 047 p., 0 01. (IV)
in terrestrial ecosystems into four main components:
aboveground, subsurface biomass, soil, and dead organic C represents soil carbon density (t/ha) obtained
AP
carbon pools. The specific principle and calculation according to the annual average precipitation, and C and
BP
formula are as follows: C are biomass carbon density (t/ha) determined by the
BT
annual average temperature and precipitation. P stands
C C C C C S C, total C (I) for annual average precipitation (mm), and T stands for
n
i
i
below i
above i
soil i
dead i
i1 i annual average temperature (℃).
’
In Equation I, C stands for carbon storage, S stands for C AP
i
i
the area of each land-use type, and C , C ,C , K = C ’’ (V)
S
above i
below i
soil i
and C represent the aboveground, subsurface, soil, and AP
dead i
dead organic carbon density, respectively. C total is the total C ’ BP
carbon storage, and n is the number of land-use types. K BP = C ’’ (VI)
Estimating carbon storage using this approach requires BP
knowledge of the carbon density (Dai et al., 2017). C ’
K BT = BT (VII)
’’
2.3.2. Carbon density C BT
Carbon density (carbon storage per unit area) is a necessary K K BP K BT (VIII)
B
input parameter in the InVEST model, which changes K and K are factors for adjusting the carbon density of
depending on climate, soil conditions, and land use. Both soil and biomass, respectively. K and K are the
s
B
BP
BT
aboveground and underground biomass carbon density, adjustment coefficients for biomass carbon density based
as well as soil organic carbon density, were found to be on precipitation and temperature. C ’ and C represent
’
positively correlated with annual precipitation. Therefore, the soil and biomass carbon density determined by
AP
BP
we adjusted soil carbon density using precipitation precipitation in Sichuan province (Ren et al., 2021). C ’’
(Equations II, III, and IV) in this study. and C represent the soil and biomass carbon density in
AP
’’
BP
C 3 3968. P 3996 1. R 2 0 11. (II) Yunnan province, determined by precipitation variables.
AP
C BT and C ’’ BT are biomass carbon density values
’
C BP 6 798. e 0 0054. P R 2 070. (III) determined by temperature parameters in Yunnan
province and Sichuan province, respectively.
Volume 6 Issue 3 (2024) 3 https://doi.org/10.36922/jcau.3069