
Page 102 - JCAU-6-3
P. 102
Journal of Chinese
Architecture and Urbanism Influence of land-use change on carbon storage
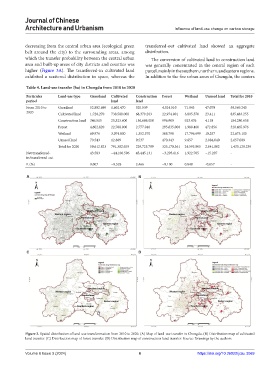
decreasing from the central urban area (ecological green transferred-out cultivated land showed an aggregate
belt around the city) to the surrounding areas, among distribution.
which the transfer probability between the central urban The conversion of cultivated land to construction land
area and built-up areas of city districts and counties was was generally concentrated in the central region of each
higher (Figure 3A). The transferred-in cultivated land parcel, mainly in the southern, northern, and eastern regions.
exhibited a scattered distribution in space, whereas the In addition to the five urban areas of Chengdu, the centers
Table 4. Land‑use transfer (ha) in Chengdu from 2010 to 2020
Particular Land‑use type Grassland Cultivated Construction Forest Wetland Unused land Total for 2010
period land land
From 2010 to Grassland 52,802.699 1,602.470 520.539 4,524.510 71.943 47.079 59,569.240
2020 Cultivated land 1,720.270 738,580.000 68,379.203 22,974.801 3,805.570 23.411 835,483.255
Construction land 346.515 25,323.600 156,686.000 996.909 923.476 4.158 184,280.658
Forest 4,602.820 22,788.900 2,777.940 295,835.000 1,988.460 472.856 328,465.976
Wetland 69.976 3,074.800 1,352.570 368.798 17,796.699 10.257 22,673.100
Unused land 70.543 12.889 9.537 470.343 9.657 2,084.040 2,657.009
Total for 2020 59,612.823 791,382.659 229,725.789 325,170.361 24,595.805 2,641.802 1,433,129.239
Net transferred- 43.583 −44,100.596 45,445.131 −3,295.616 1,922.705 −15.207 -
in/transferred-out
R (%) 0.007 −0.528 2.466 −0.100 0.848 -0.057 -
A B
C D
Figure 3. Spatial distribution of land-use transformation from 2010 to 2020. (A) Map of land-use transfer in Chengdu. (B) Distribution map of cultivated
land transfer. (C) Distribution map of forest transfer. (D) Distribution map of construction land transfer. Source: Drawings by the authors
Volume 6 Issue 3 (2024) 6 https://doi.org/10.36922/jcau.3069