
Page 101 - JCAU-6-3
P. 101
Journal of Chinese
Architecture and Urbanism Influence of land-use change on carbon storage
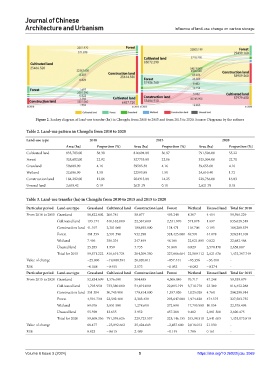
Figure 2. Sankey diagram of land-use transfer (ha) in Chengdu from 2010 to 2015 and from 2015 to 2020. Source: Diagrams by the authors
Table 2. Land‑use pattern in Chengdu from 2010 to 2020
Land‑use type 2010 2015 2020
Area (ha) Proportion (%) Area (ha) Proportion (%) Area (ha) Proportion (%)
Cultivated land 835,703.00 58.30 816694.00 56.97 791,596.00 55.22
Forest 328,602,00 22.92 327735.00 22.86 325,304.00 22.70
Grassland 59,609.90 4.16 59585.30 4.16 59,653.60 4.16
Wetland 22,686.90 1.58 22593.80 1.58 24,610.40 1.72
Construction land 184,292.00 12.86 204313.00 14.25 229,736.00 16.03
Unused land 2,658.42 0.19 2621.79 0.18 2,621.79 0.18
Table 3. Land‑use transfer (ha) in Chengdu from 2010 to 2015 and 2015 to 2020
Particular period Land‑use type Grassland Cultivated land Construction land Forest Wetland Unused land Total for 2010
From 2010 to 2015 Grassland 58,822.602 206.781 58.877 495.248 8.307 4.414 59,596.229
Cultivated land 193.174 810,162.000 22,367.600 2,531.970 371.878 1.697 835,628.318
Construction land 41.107 3,301.060 180,695.000 134.471 116.706 0.195 184,288.539
Forest 481.559 2,591.590 932.290 324,425.000 69.591 44.078 328,544.108
Wetland 7.496 356.334 247.849 48.166 22,021.801 0.822 22,682.468
Unused land 25.285 1.959 7.735 51.808 0.829 2,570.470 2,658.087
Total for 2015 59,571.222 816,619.724 204,309.350 327,686.664 22,589.112 2,621.676 1,433,397.749
Value of change −25.006 −19,008.594 20,020.811 −857.444 −93.356 −36.410 -
R/% −0.008 −0.455 2.173 −0.052 −0.082 −0.274 -
Particular period Land‑use type Grassland Cultivated land Construction land Forest Wetland Unused land Total for 2015
From 2015 to 2020 Grassland 52,834.699 1,576.690 504.485 4,506.040 70.717 47.248 59,539.879
Cultivated land 1,705.950 733,380.000 54,819.000 22,805.199 3,718.770 23.369 816,452.288
Construction land 351.304 30,745.900 170,814.000 1,357.930 1,025.020 4.760 204,298.914
Forest 4,591.730 22,592.400 2,303.430 295,647.000 1,974.620 474.575 327,583.755
Wetland 69.076 3,051.980 1,278.690 372.698 17,795.900 10.154 22,578.498
Unused land 55.598 12.655 3.952 457.288 9.482 2,081.500 2,620.475
Total for 2020 59,608.356 791,359.626 229,723.557 325,146.155 245,94.510 2,641.605 1,433,073.810
Value of change 68.477 −25,092.662 25,424.643 −2,437.600 2,016.012 21.130 -
R/% 0.023 −0.615 2.489 −0.149 1.786 0.161 -
Volume 6 Issue 3 (2024) 5 https://doi.org/10.36922/jcau.3069