
Page 81 - JCAU-7-1
P. 81
Journal of Chinese
Architecture and Urbanism Machine-simulated scoring of child-friendly streets
3. Methodology framework View photographs of these segments, merging them
into panoramic images. The panoramas were generated
3.1. Sham Shui Po district
automatically using Python and OpenCV protocols,
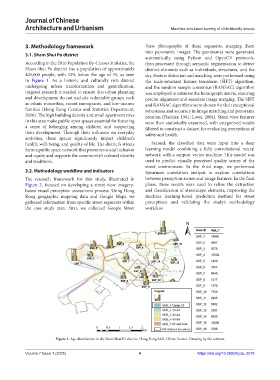
According to the 2016 Population By-Census Statistics, the then processed through semantic segmentation to detect
Sham Shui Po district has a population of approximately distinct elements such as individuals, structures, and the
405,000 people, with 12% below the age of 15, as seen sky. Feature detection and matching were performed using
in Figure 1. As a historic and culturally rich district the scale-invariant feature transform (SIFT) algorithm,
undergoing urban transformation and gentrification, and the random sample consensus (RANSAC) algorithm
targeted research is needed to ensure that urban planning was employed to estimate the homograph matrix, ensuring
and development do not exclude vulnerable groups such precise alignment and seamless image merging. The SIFT
as ethnic minorities, recent immigrants, and low-income and RANSAC algorithms were chosen for their exceptional
families (Hong Kong Census and Statistics Department, robustness and accuracy in image matching and panorama
2016). The high building density and small apartment sizes creation (Fischler, 1981; Lowe, 2004). Street view features
in this area make public open spaces essential for fostering were then statistically examined, with categorized results
a sense of belonging among children and supporting filtered to construct a dataset for evaluating perceptions of
their development. Through their influence on everyday safety and health.
activities, these spaces significantly impact children’s
health, well-being, and quality of life. The district’s streets Second, the classified data were input into a deep
form a public space network that promotes social inclusion learning model combining a fully convolutional neural
and equity and supports the community’s cultural identity network with a support vector machine. This model was
and traditions. used to predict visually perceived quality scores of the
street environment. In the third stage, we performed
3.2. Methodology workflow and indicators Spearman correlation analysis to explore correlations
The research framework for this study, illustrated in between perception scores and image features. In the final
Figure 2, focused on developing a street view imagery- phase, these results were used to refine the extraction
based visual perception assessment process. Using Hong and classification of streetscape elements, improving the
Kong geographic mapping data and Google Maps, we machine learning-based prediction method for street
gathered information from specific street segments within perceptions and validating the study’s methodology
the case study area. First, we collected Google Street workflow.
Figure 1. Age distribution in the Sham Shui Po district, Hong Kong SAR, China. Source: Drawing by the authors
Volume 7 Issue 1 (2025) 4 https://doi.org/10.36922/jcau.3578