
Page 82 - JCAU-7-1
P. 82
Journal of Chinese
Architecture and Urbanism Machine-simulated scoring of child-friendly streets
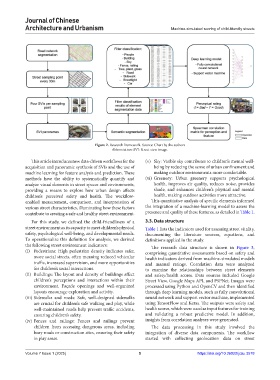
Figure 2. Research framework. Source: Chart by the authors
Abbreviation: SVI: Street view image.
This article introduces new data-driven workflows for the (v) Sky: Visible sky contributes to children’s mental well-
acquisition and panoramic synthesis of SVIs and the use of being by reducing the sense of urban confinement and
machine learning for feature analysis and prediction. These making outdoor environments more comfortable.
methods have the ability to systematically quantify and (vi) Greenery: Urban greenery supports psychological
analyze visual elements in street spaces and environments, health, improves air quality, reduces noise, provides
providing a means to explore how urban design affects shade, and enhances children’s physical and mental
children’s perceived safety and health. The workflow- health, making outdoor activities more attractive.
enabled measurement, comparison, and interpretation of This quantitative analysis of specific elements informed
various street characteristics, illuminating how these factors the integration of a machine-learning model to assess the
contribute to creating a safe and healthy street environment. presence and quality of these features, as detailed in Table 1.
For this study, we defined the child-friendliness of a 3.3. Data structure
street environment as its capacity to meet children’s physical Table 1 lists the indicators used for assessing street vitality,
safety, psychological well-being, and developmental needs. documenting the literature sources, equations, and
To operationalize this definition for analysis, we derived definitions applied in the study.
the following street environment indicators: The research data structure is shown in Figure 3,
(i) Pedestrians: High pedestrian density indicates safer, comprising quantitative assessments based on safety and
more social streets, often meaning reduced vehicular health indicators derived from machine-simulated models
traffic, increased supervision, and more opportunities and manual ratings. Correlation data were analyzed
for children’s social interactions. to examine the relationships between street elements
(ii) Buildings: The layout and density of buildings affect and safety/health scores. Data sources included Google
children’s perceptions and interactions within their Street View, Google Maps API, and PSPNet. Images were
environment. Façade openings and well-organized processed using Python and OpenCV and then identified
layouts encourage exploration and activity. through deep learning models, such as fully convolutional
(iii) Sidewalks and roads: Safe, well-designed sidewalks neural network and support vector machine, implemented
are crucial for children’s safe walking and play, while using TensorFlow and Keras. The outputs were safety and
well-maintained roads help prevent traffic accidents, health scores, which were used as input features for training
ensuring children’s safety. and validating a robust predictive model. In addition,
(iv) Fences and railings: Fences and railings prevent insights from correlation analyses were generated.
children from accessing dangerous areas, including The data processing in this study involved the
busy roads or construction sites, ensuring their safety integration of diverse data components. The workflow
in play areas. started with collecting geolocation data on street
Volume 7 Issue 1 (2025) 5 https://doi.org/10.36922/jcau.3578