
Page 83 - JCAU-7-1
P. 83
Journal of Chinese
Architecture and Urbanism Machine-simulated scoring of child-friendly streets
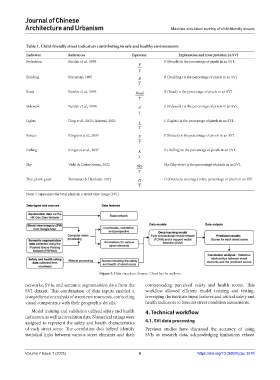
Table 1. Child‑friendly street indicators contributing to safe and healthy environments
Indicator References Equation Explanation and interpretation in SVI
Pedestrian Burden et al., 1999 P (People) is the percentage of pixels in an SVI.
P
T
Building Bornstein, 1985 B B (Building) is the percentage of pixels in an SVI.
T
Road Burden et al., 1999 Road R (Road) is the percentage of pixels in an SVI.
T
Sidewalk Burden et al., 1999: S S (Sidewalk) is the percentage of pixels in an SVI.
T
Lights Ding et al., 2023; Jahromi, 2020 L L (Lights) is the percentage of pixels in an SVI.
T
Fences Kingston et al., 2007 F F (Fences) is the percentage of pixels in an SVI.
T
Railing Kingston et al., 2007 R R (Railing) is the percentage of pixels in an SVI.
T
Sky Vidal & Castro Seixas, 2022 Sky Sky (Sky view) is the percentage of pixels in an SVI.
T
Tree, plant, grass Yuniastuti & Hasibuan, 2019 G G (Greenery coverage) is the percentage of pixels in an SVI.
T
Note: represents the total pixels in a street view image (SVI).
Figure 3. Data structure. Source: Chart by the authors
networks, SVIs, and semantic segmentation data from the corresponding perceived safety and health scores. This
SVI dataset. This combination of data inputs enabled a workflow allowed efficient model training and testing,
comprehensive analysis of street environments, connecting leveraging the intricate input features and critical safety and
visual components with their geographic details. health indicators to forecast street condition assessments.
Model training and validation utilized safety and health 4. Technical workflow
indicators, as well as correlation data. Numerical ratings were
assigned to represent the safety and health characteristics 4.1. SVI data processing
of each street scene. The correlation data helped identify Previous studies have discussed the accuracy of using
statistical links between various street elements and their SVIs as research data, acknowledging limitations related
Volume 7 Issue 1 (2025) 6 https://doi.org/10.36922/jcau.3578