
Page 90 - JCAU-7-1
P. 90
Journal of Chinese
Architecture and Urbanism Machine-simulated scoring of child-friendly streets
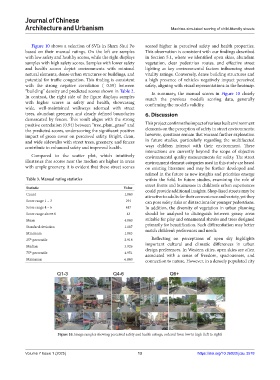
Figure 10 shows a selection of SVIs in Sham Shui Po scored higher in perceived safety and health properties.
based on their manual ratings. On the left are samples This observation is consistent with our findings described
with low safety and healthy scores, while the right displays in Section 5.1, where we identified open skies, abundant
samples with high safety scores. Samples with lower safety vegetation, clear pedestrian routes, and effective street
and health scores depict environments with minimal lighting as key environmental factors influencing street
natural elements, dense urban structures or buildings, and vitality ratings. Conversely, dense building structures and
potential for traffic congestion. This finding is consistent a high presence of vehicles negatively impact perceived
with the strong negative correlation (−0.59) between safety, aligning with visual representations in the heatmap.
“building” density and predicted scores shown in Table 2. In summary, the manual scores in Figure 10 closely
In contrast, the right side of the figure displays samples match the previous model’s scoring data, generally
with higher scores in safety and health, showcasing confirming the model’s validity.
wide, well-maintained walkways adorned with street
trees, abundant greenery, and clearly defined boundaries 6. Discussion
demarcated by fences. This result aligns with the strong
positive correlation (0.94) between “tree_plant_grass” and This project confirms the impact of various built environment
the predicted scores, underscoring the significant positive elements on the perception of safety in street environments;
impact of green cover on perceived safety. Bright, clean, however, questions remain that warrant further exploration
and wide sidewalks with street trees, greenery, and fences in future studies, particularly regarding the multifaceted
contribute to enhanced safety and improved health. ways children interact with their environment. These
interactions are currently beyond the scope of objective
Compared to the scatter plot, which intuitively environmental quality measurements for safety. The street
illustrates that scores near the median are higher in areas environment element categories used in this study are based
with ample greenery, it is evident that these street scenes on existing literature and may be further developed and
refined in the future as new insights and priorities emerge
Table 3. Manual rating statistics within the field. In future studies, examining the role of
street fronts and businesses in children’s urban experiences
Statistic Value could provide additional insights. Shop-lined streets may be
Count 1,000 attractive to adults for their convenience and variety, yet they
Score range 1 – 3 291 can pose safety risks or distractions for younger pedestrians.
Score range 4 – 6 447 In addition, the diversity of vegetation in urban planning
Score range above 6 43 should be analyzed to distinguish between grassy areas
Mean 4.000 suitable for play and ornamental shrubs and trees designed
Standard deviation 1.187 primarily for beautification. Such differentiation may better
Minimum 1.003 match children’s preferences and needs.
25 percentile 2.918 Reflecting on perceptions of open sky highlights
th
Median 3.926 important cultural and climatic differences in urban
design preferences. In Western cities, open skies are often
75 percentile 4.951 associated with a sense of freedom, spaciousness, and
th
Maximum 6.800 connection to nature. However, in a densely populated city
Figure 10. Image samples showing perceived safety and health ratings, ordered from low to high (left to right)
Volume 7 Issue 1 (2025) 13 https://doi.org/10.36922/jcau.3578