
Page 126 - JCAU-7-2
P. 126
Journal of Chinese
Architecture and Urbanism Heritage tourism: Personal and collective factors
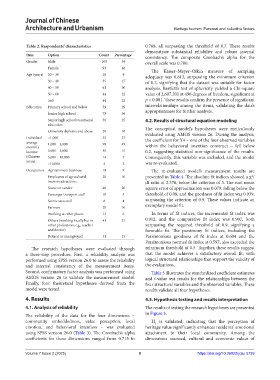
Table 2. Respondents’ characteristics 0.768, all surpassing the threshold of 0.7. These results
demonstrate substantial reliability and robust internal
Item Option Count Percentage consistency. The composite Cronbach’s alpha for the
Gender Male 109 54 overall scale was 0.780.
Female 93 46
The Kaiser–Meyer–Olkin measure of sampling
Age (years) 20 – 30 18 9 adequacy was 0.813, surpassing the minimum criterion
30 – 40 35 17 of 0.7, signifying that the dataset was suitable for factor
40 – 50 61 30 analysis. Bartlett’s test of sphericity yielded a Chi-square
50 – 60 44 22 value of 2,607.201 at 496 degrees of freedom, significant at
≥60 44 22 p < 0.001. These results confirm the presence of significant
Education Primary school and below 59 29 interrelationships among the items, validating the data’s
appropriateness for further analysis.
Junior high school 73 36
Senior high school/vocational 50 25 4.2. Results of structural equation modeling
education
University diploma and above 20 10 The conceptual model’s hypotheses were meticulously
Individual <1,000 55 27 evaluated using AMOS version 26. During the analysis,
the coefficient for Y4 – one of the four observed variables
average 1,000 – 3,000 99 49
monthly within the behavioral intention construct – fell below
income 3,001 – 5,000 30 15 0.2, suggesting statistical non-significance of the results.
(Chinese 5,001 – 10,000 14 7 Consequently, this variable was excluded, and the model
yuan)
>10,000 4 2 was re-evaluated.
Occupation Agritainment business 19 9 The re-evaluated model’s measurement results are
Employees of agricultural 20 10 presented in Table 4. The absolute fit indices showed a χ /
2
tourism attractions df ratio of 2.376, below the criterion of 3. The root mean
Souvenir vendor 40 20 square error of approximation was 0.079, falling below the
Passenger transport staff 10 5 threshold of 0.08, and the goodness of fit index was 0.939,
Scenic area staff 8 4 surpassing the criterion of 0.9. These values indicate an
Farmers 20 10 exemplary model fit.
Working at other places 13 6 In terms of fit indices, the incremental fit index was
Others (working locally but in 41 21 0.912, and the comparative fit index was 0.907, both
other professions, e.g., teacher surpassing the required threshold of 0.9, signifying a
and doctor) favorable fit. The parsimony fit indices, including the
Retired or unemployed 31 15 Parsimonious goodness of fit index at 0.604 and the
Parsimonious normed fit index at 0.597, also exceeded the
The research hypotheses were evaluated through minimum threshold of 0.5. Together, these results suggest
a three-step procedure. First, a reliability analysis was that the model achieves a satisfactory overall fit, with
performed using SPSS version 26.0 to assess the reliability logical structural relationships that support the validity of
and internal consistency of the measurement items. the evaluations.
Second, confirmatory factor analysis was performed using Table 5 illustrates the standardized coefficient estimates
AMOS version 26 to validate the measurement model. and t-value test results for the relationships between the
Finally, four theoretical hypotheses derived from the four structural variables and the observed variables. These
model were tested. results validate all four hypotheses.
4. Results 4.3. Hypothesis testing and results interpretation
4.1. Analysis of reliability The results of testing the research hypotheses are presented
The reliability of the data for the four dimensions – in Figure 3.
community embeddedness, value perception, local H is validated, indicating that the perception of
1
emotion, and behavioral intention – was evaluated heritage value significantly enhances residents’ emotional
using SPSS version 26.0 (Table 3). The Cronbach’s alpha attachment to their local community. Among the
coefficients for these dimensions ranged from 0.715 to dimensions assessed, cultural and economic values of
Volume 7 Issue 2 (2025) 8 https://doi.org/10.36922/jcau.5739