
Page 44 - JCBP-1-2
P. 44
Journal of Clinical and
Basic Psychosomatics Thyroid hormones and psychiatric disorders
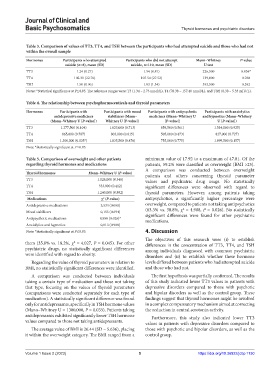
Table 3. Comparison of values of TT3, TT4, and TSH between the participants who had attempted suicide and those who had not
within the overall sample
Hormones Participants who attempted Participants who did not attempt Mann–Whitney P‑value
suicide (n=8), mean (SD) suicide, n=110, mean (SD) U test
TT3 1.24 (0.27) 1.54 (0.81) 226,500 0.034*
TT4 102.31 (22.76) 107.54 (27.52) 139,000 0.760
TSH 1.50 (0.96) 1.93 (1.34) 353,500 0.392
Notes: *Statistical significance at P≤0.05. The reference ranges were: T3 (1.34 – 2.73 nmol/L), T4 (78.38 – 157.40 nmol/L), and TSH (0.38 – 5.33 mIU/L).
Table 4. The relationship between psychopharmaceuticals and thyroid parameters
Hormones Participants with Participants with mood Participants with antipsychotic Participants with anxiolytics
antidepressive medicines stabilizers (Mann– medicines (Mann–Whitney U and hypnotics (Mann–Whitney
(Mann–Whitney U [P‑value]) Whitney U [P‑value]) [P‑value]) U [P‑value])
TT3 1.277,500 (0.104) 1.623,000 (0.713) 659,500 (0.561) 1.534,000 (0.925)
TT4 865,000 (0.787) 803,000 (0.815) 505,000 (0.473) 827,000 (0.727)
TSH 1.300,000 (0.035*) 1.835,500 (0.476) 755,000 (0.775) 1.899,500 (0.157)
Note: *Statistically significant at P≤0.05.
Table 5. Comparison of overweight and other patients minimum value of 17.92 to a maximum of 47.81. Of the
regarding thyroid hormones and medications patients, 59.2% were classified as overweight (BMI >25).
A comparison was conducted between overweight
Thyroid hormones Mann–Whitney U (P‑value) patients and others concerning thyroid parameter
TT3 1.026,000 (0.348) values and psychiatric drug usage. No statistically
TT4 553,000 (0.412) significant differences were observed with regard to
TSH 1.240,000 (0.892) thyroid parameters. However, among patients taking
Medications χ (P‑value) antipsychotics, a significantly higher percentage were
2
Antidepressive medications 3,534 (0.060) overweight, compared to patients not taking antipsychotics
2
Mood stabilizers 0,155 (0.694) (63.3% vs. 30.8%, χ = 4.988, P = 0.026). No statistically
significant differences were found for other psychiatric
Antipsychotic medications 4,988 (0.026)* medications.
Anxiolytics and hypnotics 0,013 (0.908)
Note: *Statistically significant at P≤0.05. 4. Discussion
The objectives of this research were (i) to establish
them (35.8% vs. 18.2%, χ = 4.027, P = 0.045). For other differences in the concentration of TT3, TT4, and TSH
2
psychiatric drugs, no statistically significant differences among individuals diagnosed with common psychiatric
were identified with regard to obesity. disorders and (ii) to establish whether these hormone
Regarding the value of thyroid parameters in relation to levels differed between patients who had attempted suicide
BMI, no statistically significant differences were identified. and those who had not.
A comparison was conducted between individuals The first hypothesis was partially confirmed. The results
taking a certain type of medication and those not taking of this study indicated lower TT3 values in patients with
that type, focusing on the values of thyroid parameters depressive disorders compared to those with psychotic
(comparisons were conducted separately for each type of and bipolar disorders as well as the control group. These
medication). A statistically significant difference was found findings suggest that thyroid hormones might be involved
only for antidepressants, specifically in TSH hormone values in a complex compensatory mechanism aimed at correcting
(Mann–Whitney U = 1300,000, P = 0.035). Patients taking the reduction in central serotonin activity.
antidepressants exhibited significantly lower TSH hormone Furthermore, this study also indicated lower TT3
values compared to those not taking antidepressants. values in patients with depressive disorders compared to
The average value of BMI is 26.44 (SD = 5.636), placing those with psychotic and bipolar disorders, as well as the
it within the overweight category. The BMI ranged from a control group.
Volume 1 Issue 2 (2023) 5 https://doi.org/10.36922/jcbp.1130