
Page 18 - JCBP-2-2
P. 18
Journal of Clinical and
Basic Psychosomatics Allostatic overload in the medically ill
while sociodemographic variables, DSM-5 and DCPR-R DCPR-R AO were more likely to receive psychotherapy,
diagnoses, were included in the model if they reached the at least once in life (Table 2), and had significantly higher
statistically significance threshold in the binary regressions. rates of at least one DSM-5 diagnosis, with reference to
Sex and age were entered in the model as covariates. The major depressive episode or major depressive disorder
coefficient of determination R-squared was calculated as a and panic disorder. Similarly, DCPR-R diagnoses were
goodness-of-fit measure. 31,30 Multicollinearity was deemed more represented among subjects with AO, with particular
not to be problematic for the dataset since the tolerance reference to DCPR-R illness behavior diagnoses (which
index ranged from 0.93 to 0.96 and variable inflation include: a. health anxiety: with AO n = 9, 2.68% vs. without
factors ranged from 1.01 to 1.07. 30 AO n = 9, 8.65%; b. disease phobia: with AO n = 3, 0.89% vs.
The two-sided significance level was set at p < 0.05. The n = 3, 2.88%; c. hypochondriasis: with AO n = 3, 0.89% vs.
Statistical Package for the Social Sciences (Version 20.0) without AO n = 4, 3.84%; d. thanatophobia: with AO n = 3,
was used in the analyses. 0.89% vs. without AO n = 1, 0.96%; e. illness denial: with
AO n = 9, 2.68% vs. without AO n = 8, 7.69%; f. persistent
3. Results somatization: with AO n = 15, 4.47% vs. without AO n = 8,
7.69%; g. conversion symptoms: with AO n = 3, 0.89% vs.
Four hundred and thirty-nine patients were without AO n = 5, 4.80%; h. anniversary reaction: with
enrolled. At the time of the study, the subjects were aged AO n = 7, 2.08% vs. without AO n = 8, 7.69%), DCPR-R
51.26 ± 15.07 years (Levene’s test for age: 0.16, P = 0.682). psychological manifestations (which include: a. secondary
Most of the subjects were females (n = 361, 82.23%), married somatic symptoms: with AO n = 2, 0.59% vs. without AO
(n = 287, 65.37%), employed (n = 260, 59.22%), and had high n = 0; b. irritable mood: with AO n = 17, 2.07% vs. without
school education (n = 211, 48.06%). A total of 39 subjects AO n = 15, 14.42%), DCPR-R demoralization, and DCPR-R
(8.88%) had a diagnosis of blood cancer, 200 (45.55%) had Type A behavior (Table 3).
a diagnosis of systemic sclerosis, and 200 (45.55%) had a
diagnosis of migraine. Among them, a total of 104 (23.69%) Based on the multiple logistic regression analysis, females
subjects had a diagnosis of DCPR-R AO, which was and unmarried subjects were more likely to face DCPR-R
distributed among the three clinical populations without AO. They were also at higher risk of satisfying a DSM-5
statistically significant difference (Table 1). Comparing diagnosis of major depressive episode or major depressive
subjects with or without DCPR-R AO, no difference was disorder and at higher risk of presenting DCPR-R diagnoses
found for age (49.12 ± 14.55 versus 51.93 ± 15.18 years, t in the cluster of illness behavior and demoralization
(df)
2
= 1.66 (437) , P = 0.096, d = −0.188). Females were distributed (x 2 (df) = 43.43 , R = 0.142, P < 0.001) (Table 4).
(5)
almost equally in the two AO categories. However, males 4. Discussion
not suffering from AO were twice as many as those who did
suffer from it. Being married was more represented among The present study showed that patients with a diagnosis
those without AO than among those with AO. Subjects with of cancer, migraine, or systemic sclerosis did not differ for
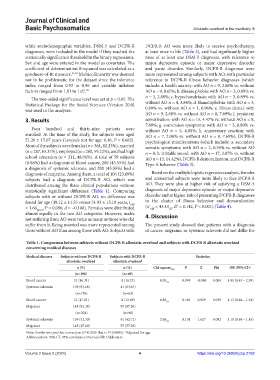
Table 1. Comparison between subjects without DCPR‑R allostatic overload and subjects with DCPR‑R allostatic overload
concerning medical diseases
Medical diseases Subjects without DCPR‑R Subjects with DCPR‑R Statistics
allostatic overload allostatic overload
n (%) n (%) Chi‑square P Z Phi OR (95% CI) a
(df)
(n=190) (n=49)
Blood cancer 31 (16.31) 8 (16.32) 0.00 0.999 -0.086 0.000 1.01 (0.43 – 2.39)
(1)
Systemic sclerosis 159 (83.68) 41 (83.67)
(n=176) (n=63)
Blood cancer 31 (17.61) 8 (12.69) 0.82 (1) 0.365 0.829 0.059 1.13 (0.84 – 1.54)
Migraine 145 (82.38) 55 (87.30)
(n=304) (n=96)
Systemic sclerosis 159 (52.30) 41 (42.71) 2.68 0.101 1.627 0.082 1.10 (0.84 – 1.45)
(1)
Migraine 145 (47.69) 55 (57.29)
Note: Bonferroni post hoc correction (P≤0.05/6 that is P≤0.0083). Adjusted for age.
a
Abbreviations: 95% CI: 95% confidence interval; OR: Odds ratio.
Volume 2 Issue 2 (2024) 4 https://doi.org/10.36922/jcbp.2758