
Page 38 - JCBP-2-4
P. 38
Journal of Clinical and
Basic Psychosomatics Core depressive symptoms of peripartum women
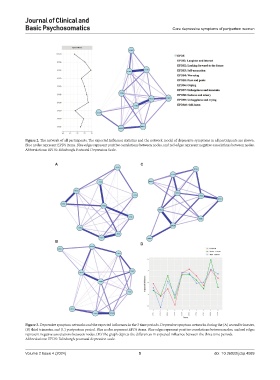
Figure 2. The network of all participants. The expected influence statistics and the network model of depressive symptoms in all participants are shown.
Blue nodes represent EPDS items. Blue edges represent positive correlations between nodes, and red edges represent negative associations between nodes.
Abbreviations: EPDS: Edinburgh Postnatal Depression Scale.
A C
B
D
Figure 3. Depressive symptom networks and the expected influences in the 3 time periods. Depressive symptom networks during the (A) second trimester,
(B) third trimester, and (C) postpartum period. Blue nodes represent EPDS items. Blue edges represent positive correlations between nodes, and red edges
represent negative associations between nodes. (D) The graph depicts the differences in expected influence between the three time periods.
Abbreviations: EPDS: Edinburgh postnatal depression scale.
Volume 2 Issue 4 (2024) 5 doi: 10.36922/jcbp.4089