
Page 39 - JCBP-2-4
P. 39
Journal of Clinical and
Basic Psychosomatics Core depressive symptoms of peripartum women
and EPDS6 (“coping”) and between EPDS8 (“sadness and the postpartum network. The stability of the strength and
misery”) and EPDS9 (“unhappiness and crying”). closeness in all three PND networks was maintained.
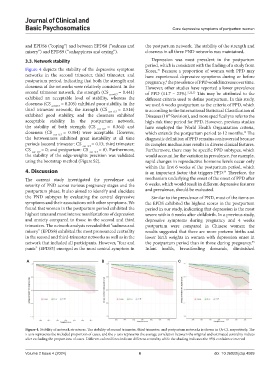
3.3. Network stability Depression was most prevalent in the postpartum
period, which is consistent with the finding of a study from
Figure 4 depicts the stability of the depressive symptom Korea. Because a proportion of women with PPD may
31
networks in the second trimester, third trimester, and have experienced depressive symptoms during or before
postpartum period, indicating that both the strength and pregnancy, the prevalence of PPD would increase over time.
6
closeness of the networks were relatively consistent. In the However, other studies have reported a lower prevalence
second trimester network, the strength (CS cor=0.7 = 0.441) of PPD (11.7 – 23%). 5,32,33 This may be attributed to the
exhibited an acceptable level of stability, whereas the different criteria used to define postpartum. In this study,
closeness (CS cor=0.7 = 0.205) exhibited poor stability. In the we used 6 weeks postpartum as the criteria of PPD, which
third trimester network, the strength (CS cor=0.7 = 0.516) is according to the International Statistical Classification of
exhibited good stability, and the closeness exhibited Diseases (10 Revision), and more specifically to refer to the
th
acceptable stability. In the postpartum network, high-risk time period for PPD. However, previous studies
the stability of both strength (CS cor=0.7 = 0.364) and have employed the World Health Organization criteria,
closeness (CS cor=0.7 = 0.364) were acceptable. However, which extends the postpartum period to 12 months. The
14
the betweenness exhibited great instability at all time diagnostic definition of PPD remains controversial because
periods (second trimester: CS cor=0.7 = 0.13; third trimester: its complex mechanisms results in diverse clinical features.
CS cor=0.7 = 0; and postpartum: CS cor=0.7 = 0). Furthermore, Furthermore, there may be specific PPD subtypes, which
the stability of the edge-weights precision was validated would account for the variation in prevalence. For example,
using the bootstrap method (Figure S2). rapid changes in reproductive hormone levels occur only
within the first 6 weeks of the postpartum period, which
4. Discussion is an important factor that triggers PPD. Therefore, the
34
The current study investigated the prevalence and mechanism underlying the onset of the onset of PPD after
severity of PND across various pregnancy stages and the 6 weeks, which would result in different depressive features
postpartum phase. It also aimed to identify and elucidate and prevalence, should be evaluated.
the PND subtypes by evaluating the central depressive Similar to the prevalence of PND, most of the items on
symptoms and their associations with other symptoms. We the EPDS exhibited the highest scores in the postpartum
found that women in the postpartum period exhibited the period in our study, indicating that depression is the most
highest rates and most intense manifestations of depression severe within 6 weeks after childbirth. In a previous study,
and anxiety compared to those in the second and third depressive symptoms during pregnancy and 4 weeks
trimesters. The network analysis revealed that “sadness and postpartum were compared in Chinese women; the
misery” (EPDS8) exhibited the most pronounced centrality results suggested that there are more preterm births and
in the second and third-trimester networks as well as in the lower birth weights in women with depression onset in
network that included all participants. However, “fear and the postpartum period than in those during pregnancy.
35
panic” (EPDS5) emerged as the most central symptom in Infant health, breastfeeding demands, diminished
A B C
Figure 4. Stability of network structures. The stability of second trimester, third trimester, and postpartum networks is shown in (A-C), respectively. The
x-axis represents the included proportion of cases, and the y-axis represents the average correlation between the original and estimated centrality indices
after excluding the proportions of cases. Different colored lines indicate different centrality while the shading indicates the 95% confidence interval
Volume 2 Issue 4 (2024) 6 doi: 10.36922/jcbp.4089