
Page 73 - JCBP-2-4
P. 73
Journal of Clinical and
Basic Psychosomatics Profiles of attention and executive function in epilepsy versus psychogenic seizures
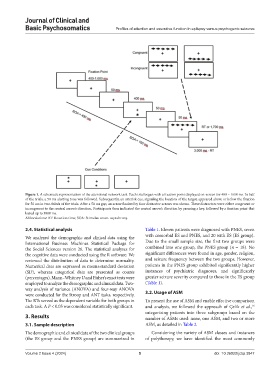
Figure 1. A schematic representation of the attentional network task. Each trial began with a fixation point displayed on-screen for 400 – 1600 ms. In half
of the trials, a 50 ms alerting tone was followed. Subsequently, an asterisk cue, signaling the location of the target, appeared above or below the fixation
for 50 ms in two-thirds of the trials. After a 50 ms gap, an arrow flanked by four distractor arrows was shown. These distractors were either congruent or
incongruent to the central arrow’s direction. Participants then indicated the central arrow’s direction by pressing a key, followed by a fixation point that
lasted up to 3000 ms.
Abbreviations: RT: Reaction time; SOA: Stimulus-onset. asynchrony.
2.4. Statistical analysis Table 1. Eleven patients were diagnosed with PNES, seven
We analyzed the demographic and clinical data using the with comorbid ES and PNES, and 20 with ES (ES group).
International Business Machines Statistical Package for Due to the small sample size, the first two groups were
the Social Sciences version 26. The statistical analyses for combined into one group, the PNES group (n = 18). No
the cognitive data were conducted using the R software. We significant differences were found in age, gender, religion,
reviewed the distribution of data to determine normality. and seizure frequency between the two groups. However,
Numerical data are expressed as mean±standard deviation patients in the PNES group exhibited significantly higher
(SD), whereas categorical data are presented as counts instances of psychiatric diagnoses, and significantly
(percentages). Mann–Whitney U and Fisher’s exact tests were greater seizure severity compared to those in the ES group
employed to analyze the demographic and clinical data. Two- (Table 1).
way analysis of variance (ANOVA) and four-way ANOVA
were conducted for the Stroop and ANT tasks, respectively. 3.2. Usage of ASM
The RTs served as the dependent variable for both groups in To present the use of ASM and enable effective comparison
each task. A P < 0.05 was considered statistically significant. and analysis, we followed the approach of Çelik et al.,
16
categorizing patients into three subgroups based on the
3. Results number of ASMs used: none, one ASM, and two or more
3.1. Sample description ASM, as detailed in Table 2.
The demographic and clinical data of the two clinical groups Considering the variety of ASM classes and instances
(the ES group and the PNES group) are summarized in of polytherapy, we have identified the most commonly
Volume 2 Issue 4 (2024) 5 doi: 10.36922/jcbp.3847