
Page 94 - JCBP-3-1
P. 94
Journal of Clinical and
Basic Psychosomatics HDL markers and suicidal ideation
Appendix
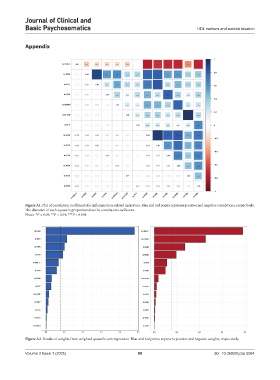
Figure A1. Plot of correlation coefficients for inflammation-related indicators. Blue and red points represent positive and negative correlations, respectively.
The diameter of each square is proportional to the correlation coefficient.
Notes: *P < 0.05; **P < 0.01; ***P < 0.001.
Figure A2. Results of weights from weighted quantile sum regression. Blue and red points represent positive and negative weights, respectively.
Volume 3 Issue 1 (2025) 88 doi: 10.36922/jcbp.5084