
Page 57 - JCBP-3-2
P. 57
Journal of Clinical and
Basic Psychosomatics Interpersonal relationship rating scale
coefficients below 0.4 were considered insufficiently
differentiated and were removed from the scale. 20
After statistical analysis, eight items did not meet
the requirements and were excluded: Item 10 (0.364),
Item 13 (0.298), Item 18 (0.381), Item 20 (0.170), Item
22 (0.315), Item 23 (0.230), Item 29 (−0.041), and Item
30 (0.375). The remaining items demonstrated a good
degree of differentiation. The 22 retained items and their
correlation coefficients with the total score are listed in
Table A2.
3.1.2. Exploratory factor analysis
Exploratory factor analysis was conducted on the first stage
of sample data. The results of Bartlett’s test of sphericity
were significant, with a KMO = 0.914, χ = 3,802.636,
2
df = 231, P < 0.001, indicating that the scale was suitable
for factor analysis. Principal component analysis was used
to extract common factors, and items were iteratively
analyzed and excluded step by step based on the following
principles: (i) items with similar factor loadings on two or
more common factors and (ii) items with maximum factor
loadings on common factors below 0.4 and commonalities
<0.4. Four items (Items 2, 9, 12, and 28) were removed for
not meeting these requirements, resulting in a refined scale
of 18 items (Table 1).
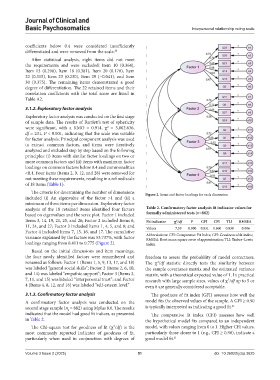
The criteria for determining the number of dimensions Figure 2. Items and factor loadings for each dimension
included (i) An eigenvalue of the factor >1 and (ii) a
minimum of three items per dimension. Exploratory factor
analysis of the 18 retained items identified four factors Table 2. Confirmatory factor analysis fit indicator values for
based on eigenvalues and the scree plot. Factor 1 included formally administered tests (n=882)
Items 3, 14, 19, 21, 25, and 26; Factor 2 included Items 6, Fit indicator χ²/df P GFI CFI TLI RMSEA
11, 24, and 27; Factor 3 included Items 1, 4, 5, and 8; and Values 7.59 0.000 0.831 0.860 0.838 0.086
Factor 4 included Items 7, 15, 16, and 17. The cumulative
variance explained by the factors was 53.737%, with factor Abbreviations: CFI: Comparative Fit Index; GFI: Goodness of fit index;
RMSEA: Root mean square error of approximation; TLI: Tucker–Lewis
loadings ranging from 0.411 to 0.775 (Figure 2). Index.
Based on the initial dimensions and item meanings,
the four newly identified factors were renumbered and freedom to assess the probability of model correctness.
renamed as follows: Factor 1 (Items 1, 5, 9, 13, 17, and 18) The χ²/df statistic directly tests the similarity between
was labeled “general social skills”; Factor 2 (Items 2, 6, 10, the sample covariance matrix and the estimated variance
and 14) was labeled “empathic support”; Factor 3 (Items 3, matrix, with a theoretical expected value of 1. In practical
7, 11, and 15) was labeled “interpersonal trust”; and Factor research with large sample sizes, values of χ²/df up to 5 or
4 (Items 4, 8, 12, and 16) was labeled “self-esteem level.” even 8 are generally considered acceptable.
3.1.3. Confirmatory factor analysis The goodness of fit index (GFI) assesses how well the
A confirmatory factor analysis was conducted on the model fits the observed values of the sample. A GFI ≥ 0.90
second stage sample (n = 882) using Mplus 8.0. The results is typically interpreted as indicating a good fit. 21
2
indicated that the model had good fit indices, as presented The comparative fit index (CFI) assesses how well
in Table 2. the hypothetical model fits compared to an independent
The Chi-square test for goodness of fit (χ²/df) is the model, with values ranging from 0 to 1. Higher CFI values,
most commonly reported indicator of goodness of fit, particularly those closer to 1 (e.g., CFI ≥ 0.90), indicate a
particularly when used in conjunction with degrees of good model fit. 21
Volume 3 Issue 2 (2025) 51 doi: 10.36922/jcbp.3625