
Page 59 - JCBP-3-2
P. 59
Journal of Clinical and
Basic Psychosomatics Interpersonal relationship rating scale
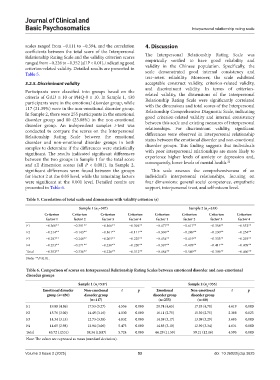
scales ranged from −0.111 to −0.394, and the correlation 4. Discussion
coefficients between the total score of the Interpersonal
Relationship Rating Scale and the validity criterion scores The Interpersonal Relationship Rating Scale was
ranged from −0.226 to −0.352 (all P < 0.01), indicating good empirically verified to have good reliability and
criterion-related validity. Detailed results are presented in validity in the Chinese population. Specifically, the
Table 5. scale demonstrated good internal consistency and
test–retest reliability. Moreover, the scale exhibited
3.2.5. Discriminant validity acceptable construct validity, criterion-related validity,
and discriminant validity. In terms of criterion-
Participants were classified into groups based on the related validity, the dimensions of the Interpersonal
criteria of GAD ≥ 10 or PHQ-9 ≥ 10. In Sample 1, 430 Relationship Rating Scale were significantly correlated
participants were in the emotional disorder group, while with the dimensions and total scores of the Interpersonal
117 (21.39%) were in the non-emotional disorder group. Relationship Comprehensive Diagnostic Scale, indicating
In Sample 2, there were 255 participants in the emotional good criterion-related validity and internal consistency
disorder group and 80 (23.88%) in the non-emotional between this scale and existing measures of interpersonal
disorder group. An independent samples t-test was relationships. For discriminant validity, significant
conducted to compare the scores on the Interpersonal differences were observed in interpersonal relationship
Relationship Rating Scale between the emotional status between the emotional disorder and non-emotional
disorder and non-emotional disorder groups in both disorder groups. This finding suggests that individuals
samples to determine if the differences were statistically with poor interpersonal relationships are more likely to
significant. The results indicated significant differences
between the two groups in Sample 1 for the total score experience higher levels of anxiety or depression and,
22
and all dimension scores (all P < 0.001). In Sample 2, consequently, lower levels of mental health.
significant differences were found between the groups This scale assesses the comprehensiveness of an
for Factor 2 at the 0.05 level, while the remaining factors individual’s interpersonal relationships, focusing on
were significant at the 0.001 level. Detailed results are four dimensions: general social competence, empathetic
presented in Table 6. support, interpersonal trust, and self-esteem level.
Table 5. Correlation of total scale and dimensions with validity criterion (r)
Sample 1 (n =547) Sample 2 (n =335)
1 2
Criterion Criterion Criterion Criterion Criterion Criterion Criterion Criterion
factor 1 factor 2 factor 3 factor 4 factor 1 factor 2 factor 3 factor 4
F1 −0.360** −0.391** −0.166** −0.394** −0.477** −0.617** −0.358** −0.532**
F2 −0.214** −0.143** −0.161** −0.111** −0.306** −0.249** −0.230** −0.254**
F3 −0.297** −0.240** −0.205** −0.225** −0.434** −0.419** −0.333** −0.293**
F4 −0.253** −0.271** −0.230** −0.220** −0.397** −0.493** −0.411** −0.409**
Total −0.352** −0.336** −0.226** −0.312** −0.484** −0.549** −0.396** −0.460**
Note: **P<0.01.
Table 6. Comparison of scores on Interpersonal Relationship Rating Scales between emotional disorder and non‑emotional
disorder groups
Sample 1 (n =547) Sample 2 (n =335)
1 2
Emotional disorder Non‑emotional t p Emotional Non‑emotional t p
group (n=430) disorder group disorder group disorder group
(n=117) (n=255) (n=80)
F1 19.88 (4.86) 17.53 (5.27) 4.556 0.000 20.74 (4.65) 17.93 (4.78) 4.619 0.000
F2 15.76 (3.00) 14.49 (3.16) 4.030 0.000 16.11 (2.75) 15.30 (2.75) 2.308 0.023
F3 14.34 (3.15) 12.73 (3.38) 4.832 0.000 14.59 (3.17) 13.09 (3.29) 3.605 0.000
F4 14.65 (2.98) 12.94 (3.06) 5.473 0.000 14.85 (3.10) 12.90 (3.34) 4.631 0.000
Total 65.72 (12.01) 59.34 (10.87) 5.724 0.000 66.29 (11.59) 59.21 (12.16) 4.595 0.000
Note: The values are expressed as mean (standard deviation).
Volume 3 Issue 2 (2025) 53 doi: 10.36922/jcbp.3625