
Page 30 - JCTR-10-3
P. 30
204 Gupta et al. | Journal of Clinical and Translational Research 2024; 10(3): 201-208
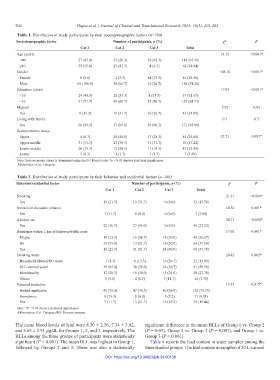
Table 1. Distribution of study participants by their sociodemographic factors (n=180)
Sociodemographic factor Number of participants, n (%) χ 2 P
Cat 1 Cat 2 Cat 3 Total
Age (years) 33.12 <0.001*
<40 27 (45.0) 35 (58.3) 56 (93.3) 118 (65.56)
≥40 33 (55.0) 25 (41.7) 4 (6.7) 62 (34.44)
Gender 108.16 <0.001*
Female 0 (0.0) 2 (3.3) 44 (73.3) 46 (25.56)
Male 60 (100.0) 58 (96.7) 16 (26.7) 134 (74.44)
Education (class) 17.09 <0.001*
<10 29 (48.3) 20 (33.3) 8 (13.3) 57 (31.67)
≥10 31 (51.7) 40 (66.7) 52 (86.7) 123 (68.33)
Migrant 5.92 0.05
Yes 8 (13.3) 19 (31.7) 16 (26.7) 43 (23.89)
Living with family 0.7 0.7
Yes 56 (93.3) 57 (95.0) 58 (96.7) 171 (95.00)
Socioeconomic status
Upper 4 (6.7) 24 (40.0) 17 (28.3) 45 (25.00) 23.21 0.001*
Upper middle 31 (51.7) 23 (38.3) 31 (51.7) 85 (47.22)
Lower middle 20 (33.3) 12 (20.0) 11 (18.3) 43 (23.89)
Lower 5 (8.3) 1 (1.7) 1 (1.7) 7 (3.89)
Note: Socioeconomic status is determined using the BG Prasad scale; *p < 0.05 denotes statistical significance.
Abbreviation: Cat: Category.
Table 2. Distribution of study participants by their behavior and residential factors (n=180)
Behavior/residential factor Number of participants, n (%) χ 2 P
Cat 1 Cat 2 Cat 3 Total
Smoking 21.51 <0.001*
Yes 13 (21.7) 19 (31.7) 0 (0.0) 32 (17.78)
Smokeless chewable tobacco 14.56 0.001*
Yes 7 (11.7) 0 (0.0) 0 (0.0) 7 (3.89)
Alcohol use 34.71 <0.001*
Yes 22 (36.7) 27 (45.0) 0 (0.0) 49 (27.22)
Residence within 1 km of highway/traffic zone 17.92 0.001*
Maybe 14 (23.3) 16 (26.7) 18 (30.0) 48 (26.67)
No 33 (55.0) 13 (21.7) 18 (30.0) 64 (35.56)
Yes 13 (21.7) 31 (51.7) 24 (40.0) 68 (37.78)
Drinking water 20.42 0.002*
Household filtered/RO water 1 (1.7) 8 (13.3) 16 (26.7) 25 (13.89)
20 L-canned water 39 (65.0) 30 (50.0) 22 (36.7) 91 (50.56)
Municipality 17 (28.3) 18 (30.0) 15 (25.0) 50 (27.78)
Others 3 (5.0) 4 (6.7) 7 (11.7) 14 (7.78)
Personal protective 12.33 0.015*
No/not applicable 45 (75.0) 47 (78.3) 40 (69.0) 132 (73.33)
Sometimes 8 (13.3) 0 (0.0) 3 (5.2) 11 (6.11)
Yes 7 (11.7) 13 (21.7) 15 (25.9) 35 (19.44)
Note: *P < 0.05 denotes statistical significance.
Abbreviation: Cat: Category; RO: Reverse osmosis.
The mean blood levels of lead were 8.50 ± 2.36, 7.34 ± 3.02, significant difference in the mean BLLs of Group 1 vs. Group 2
and 5.65 ± 2.91 µg/dL for Groups 1, 2, and 3, respectively. The (P = 0.03), Group 2 vs. Group 3 (P = 0.007), and Group 1 vs.
BLLs among the three groups of participants were statistically Group 3 (P < 0.001).
significant (P < 0.001). The mean BLL was highest in Group 1, Table 4 reports the lead content in water samples among the
followed by Groups 2 and 3. There was also a statistically three studied groups. The lead content in samples of 20 L-canned
DOI: https://doi.org/10.36922/jctr.23.00130