
Page 32 - JCTR-10-3
P. 32
206 Gupta et al. | Journal of Clinical and Translational Research 2024; 10(3): 201-208
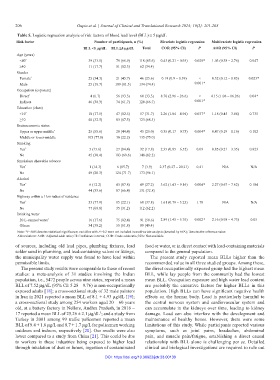
Table 5. Logistic regression analysis of risk factors of blood lead level (BLL) ≥ 5 µg/dL
Risk factor Number of participants, n (%) Bivariate logistic regression Multivariate logistic regression
BLL <5 µg/dL BLL ≥5 µg/dL Total COR (95% CI) P AOR (95% CI) P
Age (years)
<40 ^ 39 (33.1) 79 (66.9) 118 (65.6) 0.43 (0.21 – 0.93) 0.029* 1.03 (0.38 – 2.76) 0.947
≥40 11 (17.7) 51 (82.3) 62 (34.4)
Gender
Female ^ 25 (54.3) 21 (45.7) 46 (25.6) 0.19 (0.9 – 0.39) < 0.32 (0.12 – 0.85) 0.023*
Male 25 (18.7) 109 (81.3) 134 (74.4) 0.001*
Occupation (exposure)
Direct ^ 4 (6.7) 56 (93.3) 60 (33.3) 8.70 (2.96 – 26.6) < 4.15 (1.06 – 16.26) 0.04*
Indirect 46 (38.3) 74 (61.7) 120 (66.7) 0.001*
Education (class)
<10 ^ 10 (17.5) 47 (82.5) 57 (31.7) 2.26 (1.04 – 4.94) 0.037* 1.18 (0.45 – 3.08) 0.735
≥10 40 (32.5) 83 (67.5) 123 (68.3)
Socioeconomic status
Upper or upper middle ^ 25 (55.6) 20 (44.4) 45 (25.0) 0.35 (0.17 – 0.73) 0.004* 0.47 (0.19 – 1.16) 0.102
Middle or lower-middle 105 (77.8) 30 (22.2) 135 (75.0)
Smoking
Yes ^ 5 (15.6) 27 (84.4) 32 (17.8) 2.35 (0.85 – 6.52) 0.09 0.85 (0.21 – 3.35) 0.823
No 45 (30.4) 103 (69.6) 148 (82.2)
Smokeless chewable tobacco
Yes ^ 1 (14.3) 6 (85.7) 7 (3.9) 2.37 (0.27 – 20.21) 0.41 N/A N/A
No 49 (28.3) 124 (71.7) 173 (96.1)
Alcohol
Yes ^ 6 (12.2) 43 (87.8) 49 (27.2) 3.62 (1.43 – 9.16) 0.004* 2.27 (0.67 – 7.62) 0.184
No 44 (33.6) 87 (66.4) 131 (72.8)
Highway within a 1 km radius of residence
Yes ^ 53 (77.9) 15 (22.1) 68 (37.8) 1.61 (0.79 – 3.23) 1.78 N/A N/A
No 77 (68.8) 35 (31.2) 112 (62.2)
Drinking water
20 L-canned water ^ 16 (17.6) 75 (82.4) 91 (50.6) 2.89 (1.45 – 5.76) 0.002* 2.16 (0.98 – 4.73) 0.05
Others 34 (38.2) 55 (61.8) 89 (49.4)
Note: *P<0.05 denotes statistical significance; variables with P>0.2 were not included in multivariate analysis (denoted by N/A); denotes the reference value.
^
Abbreviations: AOR: Adjusted odds ratio; CI: Confidence interval; COR: Crude odds ratio; N/A: Not available.
of sources, including old lead pipes, plumbing fixtures, lead food or water, or in direct contact with lead-containing materials
solder used in plumbing, and lead-containing valves or fittings, compared to the general population.
the municipality water supply was found to have lead within The present study reported mean BLLs higher than the
permissible limits. recommended value in all three studied groups. Among these,
The present study results were comparable to those of recent the direct occupationally exposed group had the highest mean
studies: a meta-analysis of 31 studies involving the Indian BLL, while lay people from the community had the lowest
population, i.e., 5472 people across nine states, reported a mean mean BLL. Occupation exposure and high water lead content
BLL of 7.52 µg/dL (95% CI: 5.28 – 9.76) in non-occupationally are probably the causative factors for higher BLLs in this
exposed adults [18]; a cross-sectional study of 32 male painters population. High BLLs can have significant negative health
in Iran in 2021 reported a mean BLL of 8.1 ± 4.93 µg/dL [19]; effects on the human body. Lead is particularly harmful to
a cross-sectional study among 254 workers aged 20 – 60 years the central nervous system and cardiovascular system and
old, at a battery factory in Nellore, Andhra Pradesh, in 2016 – can accumulate in the kidneys over time, leading to kidney
17 reported a mean BLL of 25.26 ± 2.1 µg/dL ; and a study from damage. Lead can also interfere with the development and
3
Turkey in 2001 among 99 traffic policemen reported a mean maintenance of healthy bones. However, there were some
BLL of 9.4 ± 1.6 µg/L and 8.7 ± 1.7 µg/L for policemen working limitations of this study. While participants reported various
outdoors and indoors, respectively [20]. Our results were also symptoms, such as joint pains, headaches, abdominal
lower compared to a study from China [21]. This could be due pain, and muscle pain/fatigue, establishing a direct causal
to workers in these industries being exposed to higher lead relationship with BLL alone is challenging per se. Detailed
through inhalation of dust or fumes, ingestion of contaminated clinical and biological investigations are required to rule out
DOI: https://doi.org/10.36922/jctr.23.00130