Page 35 - JCTR-11-1
P. 35

Journal of Clinical and
            Translational Research                                                 Dexamethasone in critical COVID-19


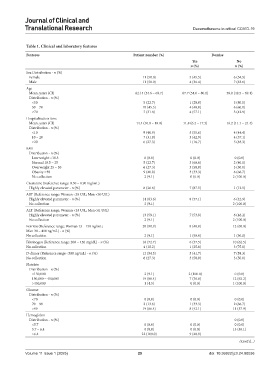
            Table 1. Clinical and laboratory features
            Features                                      Patient number (%)               Demise
                                                                                   Yes                No
                                                                                  n (%)              n (%)
            Sex Distribution - n (%)
             Female                                           11 (50.0)           5 (45.5)          6 (54.5)
             Male                                             11 (50.0)           4 (36.4)          7 (63.6)
            Age
             Mean, years (CI)                              62.14 (54.6 – 69.7)  67.7 (54.0 – 80.0)  58.8 (48.5 – 69.1)
             Distribution - n (%)
               <50                                            5 (22.7)            1 (20.0)          5 (80.0)
               50 – 70                                        10 (45.5)           4 (40.0)          6 (60.0)
               ≥70                                            7 (31.8)            4 (57.1)          3 (42.9)
            Hospitalization time
             Mean, years (CI)                              14.4 (10.8 – 18.0)  11.8 (6.2 – 17.3)  16.2 (11.1 – 21.4)
             Distribution - n (%)
               <10                                            9 (40.9)            5 (55.6)          4 (44.4)
               10 – 20                                        7 (31.8)            3 (42.9)          4 (57.1)
               ≥20                                            6 (27.3)            1 (16.7)          5 (83.3)
            BMI
             Distribution - n (%)
               Low weight <18.5                               0 (0.0)             0 (0.0)            0 (0.0)
               Normal 18.5 – 25                               5 (22.7)            3 (60.0)          2 (40.0)
               Overweight 25 – 30                             6 (27.3)            3 (50.0)          3 (50.0)
               Obesity ≥30                                    9 (40.9)            3 (33.3)          6 (66.7)
               No collection                                  2 (9.1)             0 (0.0)           2 (100.0)
            Creatinine (Reference range: 0.50 – 0.90 mg/mL)
             Highly elevated parameter - n (%)                8 (36.6)            7 (87.5)          1 (12.5)
            AST (Reference range: Woman <35 U/L; Man <50 U/L)
             Highly elevated parameter - n (%)                14 (63.6)           8 (57.1)          6 (42.9)
             No collection                                    2 (9.1)                               2 (100.0)
            ALT (Reference range: Woman <33 U/L; Man<41 U/L)
             Highly elevated parameter - n (%)                13 (59.1)           7 (53.8)          6 (46.2)
             No collection                                    2 (9.1)                               2 (100.0)
            Ferritin (Reference range: Woman 13 – 150 ng/mL;   20 (90.9)          8 (40.0)          12 (60.0)
            Man 30 – 400 ng/mL) - n (%)
            No collection                                     2 (9.1)             1 (50.0)          1 (50.0)
            Fibrinogen (Reference range: 200 – 450 mg/dL) - n (%)  16 (72.7)      6 (37.5)          10 (62.5)
            No collection                                     4 (18.2)            1 (25.0)          3 (75.0)
            D-dimer (Reference range <500 ng/mL) - n (%)      12 (54.5)           5 (41.7)          7 (58.3)
            No collection                                     6 (27.3)            3 (50.0)          3 (50.0)
            Platelets
             Distribution - n (%)
               <150,000                                       2 (9.1)            2 (100.0)           0 (0.0)
               150,000 – 450,000                              19 (86.4)           7 (36.8)          12 (63.2)
               >450,000                                       1 (4.5)             0 (0.0)           1 (100.0)
            Glucose
             Distribution - n (%)
               <70                                            0 (0.0)             0 (0.0)            0 (0.0)
               70 – 99                                        3 (13.6)            1 (33.3)          2 (66.7)
               >99                                            19 (86.4)           8 (42.1)          11 (57.9)
            Hemoglobin
             Distribution - n (%)                                                                    0 (0.0)
               <5.7                                           0 (0.0)             0 (0.0)            0 (0.0)
               5.7 – 6.4                                      0 (0.0)             0 (0.0)           13 (59.1)
               >6.4                                          22 (100.0)           9 (40.9)
                                                                                                       (Cont'd...)

            Volume 11 Issue 1 (2025)                        29                            doi: 10.36922/jctr.24.00036
   30   31   32   33   34   35   36   37   38   39   40