
Page 38 - JCTR-11-3
P. 38
Journal of Clinical and
Translational Research Immunogenicity and safety of flu vaccines
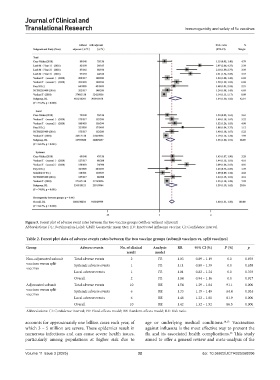
Figure 5. Forest plot of adverse event rates between the two vaccine groups (with or without adjuvant)
Abbreviations: DL: DerSimonian-Laird; GMT: Geometric mean titer; IIV: Inactivated influenza vaccine; CI: Confidence interval.
Table 2. Forest plot data of adverse events rates between the two vaccine groups (subunit vaccines vs. split vaccines)
Group Adverse events No. of clinical Analysis RR 95% Cl (%) I (%) p
2
result model
Non-adjuvanted subunit Total adverse events 2 FE 1.03 0.89 – 1.19 0.0 0.693
vaccines versus split Systemic adverse events 1 FE 1.11 0.88 – 1.39 0.0 0.658
vaccines
Local adverse events 1 FE 1.01 0.82 – 1.24 0.0 0.393
Overall 2 FE 1.04 0.94 – 1.16 0.0 0.917
Adjuvanted subunit Total adverse events 10 RE 1.54 1.29 – 1.84 91.1 0.000
vaccines versus split Systemic adverse events 6 RE 1.33 1.19 – 1.49 64.4 0.024
vaccines
Local adverse events 6 RE 1.48 1.22 – 1.80 81.9 0.000
Overall 10 RE 1.42 1.32 – 1.52 86.5 0.000
Abbreviations: CI: Confidence interval; FE: Fixed-effects model; RE: Random-effects model; RR: Risk ratio.
accounts for approximately one billion cases each year, of age or underlying medical conditions. 14,15 Vaccination
which 3 – 5 million are severe. These epidemics result in against influenza is the most effective way to prevent the
numerous infections and can cause severe health issues, flu and its associated health complications. This study
16
particularly among populations at higher risk due to aimed to offer a general review and meta-analysis of the
Volume 11 Issue 3 (2025) 32 doi: 10.36922/JCTR025060006