
Page 32 - JCTR-9-4
P. 32
248 Shuster | Journal of Clinical and Translational Research 2023; 9(4): 246-252
differ. All things being equal, the one with the greater sample (patients) with the same eligibility criteria. The inference is to this
variance in true effect sizes will have weights closer to equality target population.”
than the other, thanks to a larger between-study variance. As a Our universe is a large conceptual population of completed
concrete example, when the number of studies combined is eight, studies and the actual studies are a conceptual random sample
there is a 61% probability that one sample variance for these true from this universe. Our inference is to the target parameter in the
effect sizes will be at least 50% higher than the other. Assumption entire conceptual population. Our estimate is the corresponding
A4 requires these to be the same to a near certainty. The derivation value in the sample of studies in the analysis. The target metric
of the 61% figure is in the Appendix for those with biostatistical simply projects what the relative risk (or difference in means
expertise. The between-study variance is a major determinant of or difference in proportions) would be if all patients received
the weights and clearly differs between repetitions of obtaining the experimental therapy versus that if all patients received the
the meta-analysis data under Assumptions A1-A3. control therapy. This framework is different from the mainstream,
Support for the fact that weights are seriously random variables and hence, it is important to note that the ratio method targets a
comes from an unlikely source, lead developer of perhaps the different population parameter than the mainstream.
most popular software product for this subject, Comprehensive Note that this setup can accommodate any distribution of means
meta-analysis (CMA), Borenstein [2], who states this assumption or proportions for the two treatment arms, making it a model-free
in Section 7.4.3, “The studies that were performed are a random random effects framework for meta-analysis. The mainstream
sample from the universe.” This concedes the point that mainstream imposes severe restrictions through its five Assumptions A1-A5.
weights, which are functions of the studies, are seriously random 7.1. Illustration for relative risk (risk ratio)
variables, not constants. This potentially invalidates the claims
of no bias in the overall effect size estimate and legitimacy of For each study in the universe, if we had the number of failures
confidence intervals and P-values. on each treatment (experimental and control), we could project
In short, the mainstream relies on theory that was never the number of “failures” that would occur if every subject was
intended for this type of application and as such, the distribution in the experimental group (control group), respectively. For each
theory is used off label. individual study, this would be the total sample size (treatment +
control) for the study multiplied by the proportion failing in the
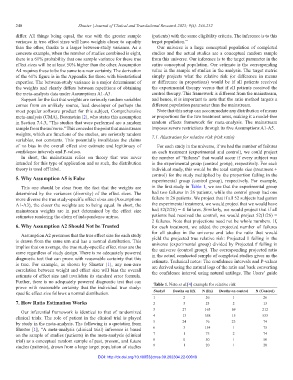
5. Why Assumption A5 is False experimental group (control group), respectively. For example,
This one should be clear from the fact that the weights are in the first study in Table 1, we see that the experimental group
determined by the variances (diversity) of the effect sizes. The had two failures in 26 patients, while the control group had one
more diverse the true study-specific effect sizes are (Assumptions failure in 26 patients. We project that if all 52 subjects had gotten
A1-A3), the closer the weights are to being equal. In short, the the experimental treatment, we would project that we would have
mainstream weights are in part determined by the effect size had 52(2/26) = 4 failures. Similarly, we would project that if all
estimates rendering the claim of independence untrue. patients had received the control, we would project 52(1/26) =
2 failures. Note that projections need not be whole numbers. If,
6. Why Assumption A2 Should Not be Trusted for each treatment, we added the projected number of failures
Assumption A2 presumes that the true effect size for each study for all studies in the universe and take the ratio that would
is drawn from the same urn and has a normal distribution. This yield the projected true relative risk: Projected # failing in the
universe (experimental group) divided by Projected # failing in
implies that on average, the true study-specific effect sizes are the the universe (control group). The corresponding projected ratio
same regardless of study design. There is no adequately powered in the actual conducted sample of completed studies gives us the
diagnostic test that can prove with reasonable certainty that this estimate. Technical notes: The confidence intervals and P-values
is true. For example, as shown by Shuster [1], any non-zero are derived using the natural logs of the ratio and back converting
correlation between weight and effect size will bias the overall the confidence interval using natural antilogs. The Users’ guide
estimate of effect size and invalidate its standard error formula.
Further, there is no adequately powered diagnostic test that can Table 1. Neto et al.[4] example for relative risk
prove with reasonable certainty that the individual true study-
specific effect size follows a normal distribution. Study# Deaths on RX N (Rx) Deaths on control N (Control)
1 2 26 1 26
7. How Ratio Estimation Works 2 3 23 2 13
Our inferential framework is identical to that of randomized 3 27 163 69 212
clinical trials. The role of patient in the clinical trial is played 4 13 558 15 533
by study in the meta-analysis. The following is a quotation from 5 24 76 23 74
Shuster [1], “A meta-analysis (clinical trial) inference is based 6 3 154 1 75
on the sample of studies (patients) in the meta-analysis (clinical 7 1 75 2 74
trial) as a conceptual random sample of past, present, and future 8 0 50 1 50
studies (patients), drawn from a large target population of studies 9 1 20 1 20
DOI: http://dx.doi.org/10.18053/jctres.09.202304.22-00019