
Page 34 - JCTR-9-4
P. 34
250 Shuster | Journal of Clinical and Translational Research 2023; 9(4): 246-252
Table 2. Results for data in Table 1
Method Estimated relative risk P‑value: two‑sided Ratio of 95% confidence
RX: control (95% CI) lengths method: Inv Var
Mainstream weights (Published) 0.71 (0.55, 0.93) 0.013 1.00
Double numerators and denominators 0.78 (0.56, 1.09) 0.15 1.15
Equally weighted 0.82 (0.54–1.26) 0.33 1.38
Ratio (Survey sampling) 0.70 (0.44, 1.11) 0.11 1.49
Table 3. Nissen and Wolski re-analysis for myocardial infarction relative risk for rosiglitazone
Method Estimated relative risk P‑value: Ratio of 95% confidence
RX: control (95% CI) two‑sided lengths method: Inv Var
Mainstream Weights (RR) 1.28 (0.94, 1.75) 0.12 1.00
Ratio (Survey Sampling) (RR) 1.41 (1.14, 1.75) 0.0026 0.82
Nissen and Wolski (OR) 1.43 (1.03–1.98) 0.032 1.03
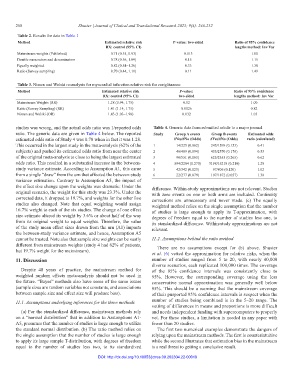
studies was wrong, and the actual odds ratio was 1/reported odds Table 4. Generic data from submitted article to a major journal
ratio. The generic data are given in Table 4 below. The reported Study Group A events Group B events Estimated odds
estimated odds ratio of Study 4 was 0.78 when in fact it was 1.28. #Yes/#No (Odds) #Yes/#No (Odds) ratio (calculated)
This occurred in the largest study in the meta-analysis (62% of the 1 14/225 (0.062) 245/1599 (0.153) 0.41
subjects) and pushed its estimated odds ratio from near the center 2 46/489 (0.094) 453/2570 (0.176) 0.53
of the original meta-analysis to close to being the largest estimated 3 90/551 (0.163) 625/2355 (0.265) 0.62
odds ratio. This resulted in a substantial increase in the between- 4 594/2204 (0.270) 3198/15218 (0.210) 1.28
study variance estimate. According to Assumption A1, this came 5 42/342 (0.123) 97/806 (0.120) 1.02
from a single “draw” from the urn that affected the between-study 6 22/277 (0.079) 107/1872 (0.057) 1.38
variance estimation. Contrary to Assumption A5, the impact of
the effect size change upon the weights was dramatic: Under the difference. Within-study approximations are not relevant. Studies
original scenario, the weight for this study was 23.3%. Under the with zero events on one or both arms are included. Continuity
corrected data, it dropped to 19.7%, and weights for the other five corrections are unnecessary and never made. (c) The equally
studies also changed. Note that equal weighting would assign weighted method relies on the single assumption that the number
16.7% weight to each of the six studies. The change of one effect of studies is large enough to apply its T-approximation, with
size estimate altered its weight by 3.6% or about half of the way degrees of freedom equal to the number of studies less one, to
from its original weight to equal weights. Therefore, the value its standardized difference. Within-study approximations are not
of the study mean effect sizes drawn from the urn (A1) impacts relevant.
the between-study variance estimate, and hence, Assumption A5
cannot be trusted. Note also that sample size weights can be vastly 11.2. Assumptions behind the ratio method
different from mainstream weights (study 4 had 62% of patients, There are no assumptions except for (b) above. Shuster
but 19.7% weight for the mainstream).
et al. [6] vetted the approximation for relative risks, when the
11. Discussion number of studies ranged from 5 to 20, with nearly 40,000
diverse scenarios, each replicated 100,000 times. The coverage
Despite 48 years of practice, the mainstream method for of the 95% confidence intervals was consistently close to
weighted random effects meta-analysis should not be used in 95%. However, the corresponding coverage using the less
the future. “Bayes” methods also have some of the same issues conservative normal approximation was generally well below
(sample sizes are random variables not constants, and associations 95%. This should be a warning that the mainstream coverage
between sample size and effect size will produce bias). of their purported 95% confidence intervals is suspect when the
11.1. Assumptions underlying inferences for the three methods number of studies being combined is in the 5–20 range. The
vetting of differences in means and proportions is more difficult
(a) For the standardized difference, mainstream methods rely and needs independent funding with supercomputers to properly
on a “normal distribution” that in addition to Assumptions A1- vet. For these studies, a limitation is needed in any paper with
A5, presumes that the number of studies is large enough to utilize fewer than 20 studies.
the standard normal distribution. (b) The ratio method relies on The first two numerical examples demonstrate the dangers of
the single assumption that the number of studies is large enough relying upon the mainstream methods. The first is counterintuitive
to apply its large sample T-distribution, with degrees of freedom while the second illustrates that estimation bias in the mainstream
equal to the number of studies less two, to its standardized is a real threat to getting a conclusive result.
DOI: http://dx.doi.org/10.18053/jctres.09.202304.22-00019