
Page 39 - JCTR-9-4
P. 39
Sondore et al. | Journal of Clinical and Translational Research 2023; 9(4): 253-260 255
Table 1. Baseline characteristics of CAS group
Characteristic Asymptomatic, n=31 Symptomatic, n=32 H/O cerebrovascular event, n=15 P‑value
Age, years 69.26±8.36 69.63±8.64 67.27±9.15 0.17
Body mass index, kg/m 2 27.05±3.61 27.55±5.64 28.37±3.81 0.44
Gender
Male, n (%) 23 (74.2) 18 (56.3) 10 (66.7) 0.32
Female, n (%) 8 (25.8) 14 (43.8) 5 (33.3) 0.32
Analyzed artery
Left internal carotid artery, n (%) 15 (48.4) 17 (53.1) 9 (60.0) 0.76
Right internal carotid artery, n (%) 16 (51.6) 15 (46.1) 6 (40.0) 0.76
Left anterior descending coronary artery, n (%) 16 (51.6) 13 (40.6) 8 (53.3) 0.60
Left circumflex coronary artery, n (%) 8 (25.8) 6 (18.8) 2 (13.3) 0.59
Right coronary artery, n (%) 7 (22.6) 13 (40.6) 5 (33.3) 0.31
SYNTAX score 17.66±4.42 16.32±5.42 19.51±3.68 0.78
Smoking
Active smoker, n (%) 2 (6.5) 3 (9.4) 4 (26.7) 0.12
Former smoker, n (%) 9 (29.0) 8 (25.0) 4 (26.7) 0.94
Non-smokers, n (%) 11 (35.5) 17 (53.1) 5 (33.3) 0.27
Diabetes mellitus, n (%) 7 (22.6) 9 (28.1) 5 (33.3) 0.73
Dyslipidemia, n (%) 30 (96.8) 31 (96.9) 15 (100) 0.78
Arterial hypertension, n (%) 26 (83.9) 27 (84.4) 15 (100) 0.25
Myocardial infarction, n (%) 12 (38.7) 11 (34.4) 6 (40.0) 0.91
PCI in history, n (%) 12 (38.7) 12 (37.5) 4 (26.7) 0.71
Peripheral arterial disease, n (%) 15 (48.4) 8 (25.0) 7 (46.7) 0.12
Familial history of cardiovascular disease, n (%) 7 (22.6) 3 (9.4) 5 (33.3) 0.15
Atrial fibrillation
Permanent, (%) 6 (19.4) 6 (18.8) 3 (20.0) 0.99
Paroxysmal, (%) 1 (3.2) 4 (12.5) 4 (26.7) 0.06
None, (%) 23 (74.2) 22 (68.8) 8 (53.3) 0.36
CAS: carotid artery stenting, PCI: Percutaneous coronary intervention
A B
C D
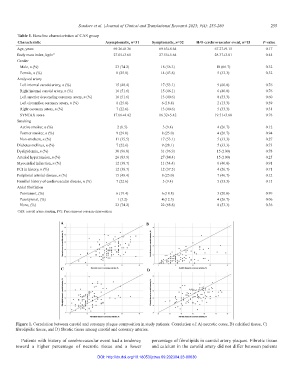
Figure 1. Correlation between carotid and coronary plaque composition in study patients. Correlation of: A) necrotic cores, B) calcified tissue, C)
fibrolipidic tissue, and D) fibrotic tissue among carotid and coronary arteries.
Patients with history of cerebrovascular event had a tendency percentage of fibrolipids in carotid artery plaques. Fibrotic tissue
toward a higher percentage of necrotic tissue and a lower and calcium in the carotid artery did not differ between patients
DOI: http://dx.doi.org/10.18053/jctres.09.202304.23-00030