
Page 40 - JCTR-9-5
P. 40
342 Xu et al. | Journal of Clinical and Translational Research 2023; 9(5): 340-346
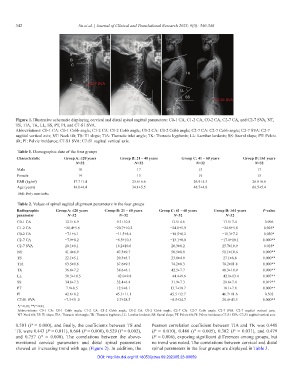
Figure 1. Illustrative schematic displaying cervical and distal spinal sagittal parameters: C0-1 CA, C1-2 CA, C0-2 CA, C2-7 CA, and C2-7 SVA, NT,
TS, TIA, TK, LL, SS, PT, PI, and C7-S1 SVA.
Abbreviations: C0-1 CA: C0-1 Cobb angle; C1-2 CA: C1-2 Cobb angle; C0-2 CA: C0-2 Cobb angle; C2-7 CA: C2-7 Cobb angle; C2-7 SVA: C2-7
sagittal vertical axis; NT: Neck tilt; TS: T1 slope; TIA: Thoracic inlet angle; TK: Thoracic kyphosis; LL: Lumbar lordosis; SS: Sacral slope; PT: Pelvic
tilt; PI: Pelvic incidence; C7-S1 SVA: C7-S1 sagittal vertical axis.
Table 1. Demographic data of the four groups
Characteristic Group A: ≤20 years Group B: 21 – 40 years Group C: 41 – 60 years Group D: ≥61 years
N=32 N=32 N=32 N=32
Male 18 17 13 17
Female 14 15 19 15
BMI (kg/m ) 17.7±1.4 23.6±6.6 26.9±5.5 26.8±6.6
2
Age (years) 14.0±4.4 34.1±5.5 48.7±4.8 66.5±5.4
BMI: Body mass index
Table 2. Values of spinal sagittal alignment parameters in the four groups
Radiographic Group A: ≤20 years Group B: 21 – 40 years Group C: 41 – 60 years Group D: ≥61 years P‑value
parameter N=32 N=32 N=32 N=32
C0-1 CA 12.5±6.9 9.3±10.8 13.5±4.6 13.5±7.4 0.096
C1-2 CA −20.4±5.6 −20.7±10.2 −24.0±5.9 −24.8±5.8 0.025*
C0-2 CA −7.1±6.1 −11.5±8.4 −10.5±6.2 −11.3±7.2 0.050*
C2-7 CA −7.9±8.2 −6.5±10.3 −13.1±8.0 −17.0±10.1 0.000**
C2-7 SVA 20.1±9.1 18.2±10.6 20.3±8.2 25.7±10.9 0.018*
NT 41.4±6.9 47.3±9.7 50.5±8.8 51.1±10.6 0.000**
TS 22.1±5.1 20.3±5.7 23.8±4.9 27.1±8.8 0.000**
TIA 63.5±9.8 67.6±9.5 74.2±8.3 78.2±11.8 0.000**
TK 36.0±7.2 38.6±8.1 42.5±7.7 48.3±10.9 0.000**
LL −50.5±10.5 −42.0±9.8 −44.4±9.6 −42.1±13.4 0.007**
SS 34.6±7.3 32.4±8.4 31.9±7.3 28.6±7.4 0.019**
PT 7.9±8.5 12.9±8.1 13.7±10.7 18.1±7.8 0.000**
PI 42.6±8.2 45.3±11.1 45.5±12.7 46.7±11.6 0.502
C7-S1 SVA −7.3±31.0 2.7±28.5 −8.5±24.7 28.4±43.3 0.000**
*P<0.05; **P<0.01.
Abbreviations: C0-1 CA: C0-1 Cobb angle; C1-2 CA: C1-2 Cobb angle; C0-2 CA: C0-2 Cobb angle; C2-7 CA: C2-7 Cobb angle; C2-7 SVA: C2-7 sagittal vertical axis;
NT: Neck tilt; TS: T1 slope; TIA: Thoracic inlet angle; TK: Thoracic kyphosis; LL: Lumbar lordosis; SS: Sacral slope; PT: Pelvic tilt; PI: Pelvic incidence; C7-S1 SVA: C7-S1 sagittal vertical axis
0.581 (P = 0.000), and finally, the coefficients between TS and Pearson correlation coefficient between TIA and TK was 0.448
TK were 0.443 (P = 0.011), 0.664 (P = 0.000), 0.529 (P = 0.002), (P = 0.010), 0.486 (P = 0.005), 0.382 (P = 0.031), and 0.479
and 0.757 (P = 0.000). The correlations between the above- (P = 0.006), exposing significant differences among groups, but
mentioned cervical parameters and distal spinal parameters no trend was noted. The correlations between cervical and distal
showed an increasing trend with age (Figure 2). In addition, the spinal parameters in the four groups are displayed in Table 3.
DOI: http://dx.doi.org/10.18053/jctres.09.202305.23-00059