
Page 39 - JCTR-9-5
P. 39
Xu et al. | Journal of Clinical and Translational Research 2023; 9(5): 340-346 341
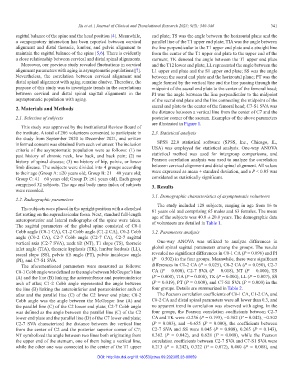
sagittal balance of the spine and the head position [4]. Meanwhile, end plate; TS was the angle between the horizontal plane and the
a compensatory interaction has been reported between cervical parallel line of the T1 upper end plate; TIA was the angle between
alignment and distal thoracic, lumbar, and pelvic alignment to the line perpendicular to the T1 upper end plate and a straight line
maintain the sagittal balance of the spine [5,6]. There is evidently from the center of the T1 upper end plate to the upper end of the
a close relationship between cervical and distal spinal alignments. sternum; TK denoted the angle between the T1 upper end plate
Moreover, our previous study revealed fluctuations in cervical and the T12 lower end plate; LL represented the angle between the
alignment parameters with aging in asymptomatic populations [7]. L1 upper end plate and the S1 upper end plate; SS was the angle
Nevertheless, the correlation between cervical alignment and between the sacral end plate and the horizontal plane; PT was the
distal spinal alignment with aging remains elusive. Therefore, the angle formed by the vertical line and the line passing through the
purpose of this study was to investigate trends in the correlations midpoint of the sacral end plate to the center of the femoral head;
between cervical and distal spinal sagittal alignments in the PI was the angle between the line perpendicular to the midpoint
asymptomatic population with aging. of the sacral end plate and the line connecting the midpoint of the
2. Materials and Methods sacral end plate to the center of the femoral head; C7-S1 SVA was
the distance between a vertical line from the center of C7 and the
2.1. Selection of subjects posterior corner of the sacrum. Examples of the above parameters
are illustrated in Figure 1.
This study was approved by the Institutional Review Board of
the institute. A total of 206 volunteers consented to participate in 2.3. Statistical analysis
the study from September 2020 to December 2021, and written
informed consent was obtained from each volunteer. The inclusion SPSS 22.0 statistical software (SPSS, Inc., Chicago, IL,
criteria of the asymptomatic population were as follows: (1) no USA) was employed for statistical analysis. One-way ANOVA
past history of chronic neck, low back, and back pain; (2) no statistical method was used for intergroup comparisons, and
history of spinal disease; (3) no history of hip, pelvic, or lower Pearson correlation analysis was used to analyze the correlation
limb disease. The subjects were divided into 4 groups according between cervical alignment and distal spinal alignment. All values
to their age (Group A: ≤20 years old; Group B: 21 – 40 years old; were expressed as mean ± standard deviation, and a P < 0.05 was
Group C: 41 – 60 years old; Group D: ≥61 years old). Each group considered as statistically significant.
comprised 32 subjects. The age and body mass index of subjects 3. Results
were recorded.
3.1. Demographic characteristics of asymptomatic volunteers
2.2. Radiographic parameters
The study included 128 subjects, ranging in age from 16 to
The subjects were placed in the upright position with a clenched 81 years old and comprising 65 males and 63 females. The mean
fist resting on the supraclavicular fossa. Next, standard full-length age of the subjects was 40.8 ± 20.0 years. The demographic data
anteroposterior and lateral radiographs of the spine were taken. of volunteers are detailed in Table 1.
The sagittal parameters of the global spine consisted of C0-1
Cobb angle (C0-1 CA), C1-2 Cobb angle (C1-2 CA), C0-2 Cobb 3.2. Parameters analysis
angle (C0-2 CA), C2-7 Cobb angle (C2-7 CA), C2-7 sagittal
vertical axis (C2-7 SVA), neck tilt (NT), T1 slope (TS), thoracic One-way ANOVA was utilized to analyze differences in
inlet angle (TIA), thoracic kyphosis (TK), lumbar lordosis (LL), global spinal sagittal parameters among the groups. The results
sacral slope (SS), pelvic tilt angle (PT), pelvic incidence angle revealed no significant differences in C0-1 CA (P = 0.096) and PI
(PI), and C7-S1 SVA. (P = 0.502) in the four groups. Meanwhile, there were significant
The aforementioned parameters were measured as follows: differences in C1-2 CA (P = 0.025), C0-2 CA (P = 0.050), C2-7
C0-1 Cobb angle was defined as the angle between McGregor’s line CA (P = 0.000), C2-7 SVA (P = 0.018), NT (P = 0.000), TS
(A) and the line (B) linking the anteroinferior and posteroinferior (P = 0.000), TIA (P = 0.000), TK (P = 0.000), LL (P = 0.007), SS
arch of atlas; C1-2 Cobb angle represented the angle between (P = 0.019), PT (P = 0.000), and C7-S1 SVA (P = 0.000) in the
the line (B) linking the anteroinferior and posteroinferior arch of four groups. Details are summarized in Table 2.
atlas and the parallel line (C) of the C2 lower end plate; C0-2 The Pearson correlation coefficients of C0-1 CA, C1-2 CA, and
Cobb angle was the angle between the McGregor line (A) and C0-2 CA and distal spinal parameters were all lower than 0.3, and
the parallel line (C) of the C2 lower end plate; C2-7 Cobb angle no apparent trend in correlation was observed with aging. In the
was defined as the angle between the parallel line (C) of the C2 four groups, the Pearson correlation coefficients between C2-7
lower end plate and the parallel line (D) of the C7 lower end plate; CA and TK were -0.236 (P = 0.193), −0.362 (P = 0.042), −0.502
C2-7 SVA characterized the distance between the vertical line (P = 0.003), and −0.655 (P = 0.000), the coefficients between
from the center of C2 and the posterior superior corner of C7; C2-7 SVA and SS were 0.045 (P = 0.808), 0.265 (P = 0.143),
NT symbolized the angle between two lines both originating from 0.362 (P = 0.042), and 0.628 (P = 0.000), while the Pearson
the upper end of the sternum, one of them being a vertical line, correlation coefficients between C2-7 SVA and C7-S1 SVA were
while the other one was connected to the center of the T1 upper 0.213 (P = 0.242), 0.322 (P = 0.072), 0.460 (P = 0.008), and
DOI: http://dx.doi.org/10.18053/jctres.09.202305.23-00059