
Page 34 - JCTR-9-5
P. 34
336 Arab et al. | Journal of Clinical and Translational Research 2023; 9(5): 332-339
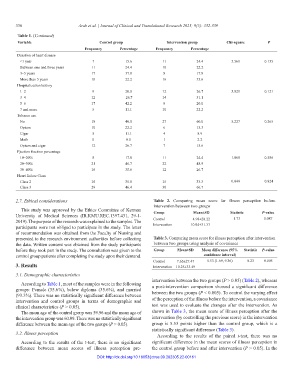
Table 1. (Continued)
Variable Control group Intervention group Chi‑square P
Frequency Percentage Frequency Percentage
Duration of heart disease
<1 year 7 15.6 11 24.4 5.561 0.135
Between one and three years 11 24.4 10 22.2
3–5 years 17 37.8 8 17.8
More than 5 years 10 22.2 16 35.6
Hospitalization history
1–2 9 20.0 12 26.7 5.821 0.121
3–4 12 26.7 14 31.1
5–6 17 42.2 9 20.0
7 and more 5 11.1 10 22.2
Tobacco use
No 18 40.0 27 60.0 5.227 0.265
Opium 10 22.2 6 13.3
Cigar 5 11.1 4 8.9
Meth 0 0.0 1 2.2
Opium and cigar 12 26.7 7 15.6
Ejection fraction percentage
10–20% 8 17.8 11 24.4 1.068 0.586
20–30% 21 46.7 22 48.9
30–40% 16 35.6 12 26.7
Heart failure Class
Class 2 16 35.6 15 33.3 0.049 0.824
Class 3 29 46.4 30 66.7
2.7. Ethical considerations Table 2. Comparing mean score for illness perception before
intervention between two groups
This study was approved by the Ethics Committee of Kerman Group Mean±SD Statistic P‑value
University of Medical Sciences (IR.KMU.REC.1397.431, 29-1- 1.73 0.087
4.98±28.22
2019). The purpose of the research was explained to the samples. The Control 10.94±31.33
Intervention
participants were not obliged to participate in the study. The letter
of recommendation was obtained from the Faculty of Nursing and
presented to the research environment authorities before collecting Table 3. Comparing mean score for illness perception after intervention
the data. Written consent was obtained from the study participants between two groups using analysis of covariance
before they took part in the study. The consultation was given to the Group Mean±SD Mean difference (95% Statistic P‑value
control group patients after completing the study upon their demand. confidence interval)
Control 7.65±27.47 5.53 (1.69, 9.36) 8.23 0.005
3. Results Intervention 10.25±33.49
3.1. Demographic characteristics
intervention between the two groups (P > 0.05) (Table 2), whereas
According to Table 1, most of the samples were in the following a post-intervention comparison showed a significant difference
groups: Female (55.6%), below diploma (35.6%), and married between the two groups (P < 0.005). To control the varying effect
(93.3%). There was no statistically significant difference between
intervention and control groups in terms of demographic and of the perception of the illness before the intervention, a covariance
clinical characteristics (P > 0.05). test was used to evaluate the changes after the intervention. As
The mean age of the control group was 59.96 and the mean age of shown in Table 3, the mean score of illness perception after the
the intervention group was 60.09. There was no statistically significant intervention (by controlling the previous score) in the intervention
difference between the mean age of the two groups (P > 0.05). group is 5.53 points higher than the control group, which is a
statistically significant difference (Table 3).
3.2. Illness perception According to the results of the paired t-test, there was no
According to the results of the t-test, there is no significant significant difference in the mean scores of illness perception in
difference between mean scores of illness perception pre- the control group before and after intervention (P > 0.05). In the
DOI: http://dx.doi.org/10.18053/jctres.09.202305.22-00161