
Page 33 - JCTR-9-5
P. 33
Arab et al. | Journal of Clinical and Translational Research 2023; 9(5): 332-339 335
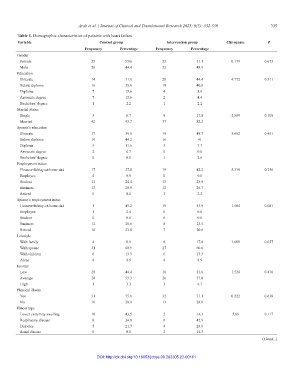
Table 1. Demographic characteristics of patients with heart failure
Variable Control group Intervention group Chi‑square P
Frequency Percentage Frequency Percentage
Gender
Female 25 55/6 23 51.1 0.179 0.673
Male 20 44.4 22 48.9
Education
Illiterate 14 31.1 20 44.4 4.772 0.311
Below diploma 16 35.6 18 40.0
Diploma 7 15.6 4 8.9
Associate degree 7 15.6 2 4.4
Bachelors’ degree 1 2.2 1 2.2
Marital Status
Single 3 6.7 8 17.8 2.589 0.108
Married 42 93.3 37 82.2
Spouse’s education
Illiterate 17 39.5 19 48.7 3.682 0.451
Below diploma 19 44.2 16 41
Diploma 5 11.6 3 7.7
Associate degree 2 4.7 0 0.0
Bachelors’ degree 0 0.0 1 2.6
Employment status
Housewife/stay-at-home dad 17 37.8 19 42.2 5.318 0.256
Employee 4 8.9 0 0.0
Student 11 24.4 13 28.9
Business 13 28.9 12 26.7
Retired 0 0.0 1 2.2
Spouse’s employment status
Housewife/stay-at-home dad 1 45.2 19 55.9 1.504 0.681
Employee 1 2.4 0 0.0
Student 0 0.0 0 0.0
Business 12 28.6 8 23.5
Retired 10 23.8 7 20.6
Lifestyle
With family 4 8.9 8 17.8 1.609 0.657
With spouse 31 68.9 27 60.0
With children 6 13.3 6 13.3
Alone 4 8.9 4 8.9
Income
Low 20 44.4 16 35.6 1.524 0.476
Average 24 53.3 26 57.8
High 1 3.3 3 6.7
Physical illness
Yes 31 75.6 32 71.1 0.222 0.638
No 10 28.9 13 28.9
Illness type
Lower extremity swelling 10 43.5 2 14.3 5.89 0.117
Respiratory disease 8 34.8 6 42.9
Diabetes 5 21.7 4 28.6
Renal disease 0 0.0 2 14.3
(Contd...)
DOI: http://dx.doi.org/10.18053/jctres.09.202305.22-00161