
Page 9 - MSAM-1-4
P. 9
Materials Science in Additive Manufacturing Y O influence in heat-treated LPBF IN718 composite
2 3
A B C
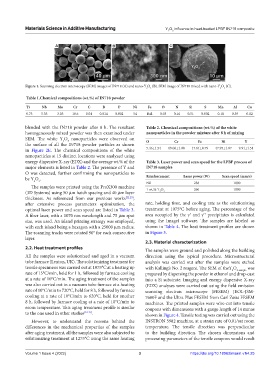
Figure 1. Scanning electron microscopy (SEM) images of IN718 (A) and nano-Y O (B). SEM image of IN718 mixed with nano-Y O (C).
2
3
2
3
Table 1.Chemical compositions (wt.%) of IN718 powder
Ti Nb Mo Cr C B P Ni Fe O N Si S Mn Al Co
0.73 5.33 3.03 18.6 0.01 0.014 0.002 54 Bal. 0.03 0.16 0.51 0.002 0.18 0.39 0.02
blended with the IN718 powder after 8 h. The resultant Table 2. Chemical compositions (wt.%) of the white
homogeneously mixed powder was then examined under nanoparticles in the powder mixture after 8 h of mixing
SEM. The white Y O nanoparticles were observed on O Cr Fe Ni Y
3
2
the surface of all the IN718 powder particles as shown
in Figure 2E. The chemical compositions of the white 5.46±1.54 19.06±1.08 17.61±0.79 47.95±1.87 9.91±1.51
nanoparticles at 15 distinct locations were analyzed using
energy dispersive X-ray (EDX) and the average wt.% of the Table 3. Laser power and scan speed for the LPBF process of
major elements is listed in Table 2. The presence of Y and IN718 samples
O was detected, further confirming the nanoparticles to
be Y O . Reinforcement Laser power (W) Scan speed (mm/s)
2 3 Nil 238 1000
The samples were printed using the ProX300 machine 1 wt.% Y O 260 1000
(3D Systems) using 50 µm hatch spacing and 40 µm layer 2 3
thickness. As referenced from our previous works [22,23] ,
after extensive process parameters optimization, the rate, holding time, and cooling rate as the solutionizing
optimal laser power and scan speed are listed in Table 3. treatment at 1075°C before aging. The percentage of the
A fiber laser, with a 1070 nm wavelength and 75 µm spot area occupied by the γ′ and γ′′ precipitates is calculated
size, was used. An island printing strategy was employed, using the ImageJ software. The samples are labeled as
with each island being a hexagon with a 25000 µm radius. shown in Table 4. The heat treatment profiles are shown
The scanning tracks were rotated 90° for each consecutive in Figure 3.
layer.
2.3. Material characterization
2.2. Heat treatment profiles The samples were ground and polished along the building
All the samples were solutionized and aged in a vacuum direction using the typical procedure. Microstructural
tube furnace (Lenton, UK). The solutionizing treatment for analysis was carried out after the samples were etched
tensile specimens was carried out at 1075°C at a heating up with Kalling’s No. 2 reagent. The SEM of theY O 3 sample was
2
rate of 15°C/min, held for 1 h, followed by furnace cooling prepared by dispersing the powder in ethanol and drop-cast
at a rate of 10°C/min. The aging treatment of the samples into a Si substrate. Imaging and energy dispersive X-ray
was also carried out in a vacuum tube furnace at a heating (EDX) analyses were carried out using the field emission
rate of 10°C/min to 720°C, held for 8 h, followed by furnace scanning electron microscope (FESEM) JEOL-JSM-
cooling at a rate of 10°C/min to 620°C, held for another 7600F and the Ultra Plus FESEM from Carl Zeiss FESEM
8 h, followed by furnace cooling at a rate of 10°C/min to machines. The printed samples were wire-cut into tensile
room temperature. This aging treatment profile is similar coupons with dimensions with a gauge length of 14 mmas
to the one used in other studies [24-27] . shown in Figure 4. Tensile testing was carried out using the
However, to understand the reasons behind the INSTRON 5982 machine, at a strain rate of 0.01/sat room
differences in the mechanical properties of the samples temperature. The tensile direction was perpendicular
after aging treatment, all the samples were also subjected to to the building direction. The chosen dimensions and
solutionizing treatment at 1275°C using the same heating processing parameters of the tensile coupons would result
Volume 1 Issue 4 (2022) 3 https://doi.org/10.18063/msam.v1i4.25