
Page 12 - MSAM-1-4
P. 12
Materials Science in Additive Manufacturing Y O influence in heat-treated LPBF IN718 composite
2 3
having high concentrations of Nb and Mo, it is identified 3.2. Microstructures of printed samples after 1075°C
to be Laves phase. This phase is usually located in the solutionized and aged
interdendritic region after solidification . Consequently, Both monolithic and Y O -reinforced samples solutionized
[30]
the nano-sized particles are identified to be NbC carbide at 1075°C are deeply etched to reveal their microstructures
3
2
precipitates. Even though element C is difficult to index, as shown in Figure 7. It can be seen that the grain structures
the identification of the phase is further supported by the of both samples consist of mostly columnar grains with
presence of elements Ti and N in the precipitates. This some equiaxed grains distributed throughout, both after
is because the pre-existing TiN in the melt often acts as solutionizing and after aging treatments. The optical
nucleation sites for the NbC precipitates due to favorable micrographs also reveal that the grains’ interior (in between
lattice match . Due to the presence of both C and N in the black dashed lines that indicate the grain boundaries)
[31]
the precipitates, they are also referred to as carbonitride of the samples after aging (Figure 7B and D) is darker than
precipitates. Moreover, Figure 5C shows that the Y O that of the samples before aging (Figure 7A and C).
2
3
nanoparticles are segregated at the interdendritic regions
where the Laves phase is usually located. SEM analysis in Figure 8 shows that the grains’ interior
consists of numerous precipitates either arranged in
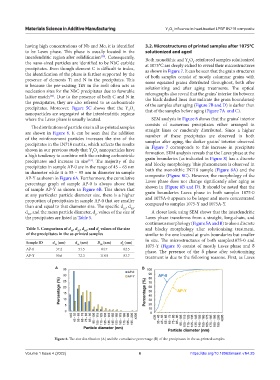
The distributions of particle size in all as-printed samples
are shown in Figure 6. It can be seen that the addition straight lines or randomly distributed. Since a higher
number of these precipitates are observed in both
of the reinforcement particles increases the size of the samples after aging, the darker grains’ interior observed
precipitates in the IN718 matrix, which reflects the results in Figure 7 corresponds to this increase in precipitate
shown in our previous study that Y O nanoparticles have formation. SEM analysis reveals that the Laves phase at the
3
2
a high tendency to combine with the existing carbonitride grain boundaries (as indicated in Figure 8) has a discrete
precipitates and increase in size . The majority of the and blocky morphology. This phenomenon is observed in
[23]
precipitates in sample AP-0 are in the range of 45 – 65 nm both the monolithic IN718 sample (Figure 8A) and the
in diameter while it is 55 – 95 nm in diameter in sample composite (Figure 8C). However, the morphology of the
AP-Y as shown in Figure 6A. Furthermore, the cumulative Laves phase does not change significantly after aging as
percentage graph of sample AP-0 is always above that shown in (Figure 8B and D). It should be noted that the
of sample AP-Y as shown in Figure 6B. This shows that grain boundaries Laves phase in both samples 1075-0
at any particular particle diameter size, there is a higher
proportion of precipitates in sample AP-0 that are smaller and 1075A-0 appears to be larger and more concentrated
than and equal to that diameter size. The specific d , d , compared to samples 1075-Y and 1075A-Y.
50
10
d , and the mean particle diameter, d , values of the size of A closer look using SEM shows that the interdendritic
90
p
the precipitates are listed in Table 5. Laves phase transforms from a straight, long-chain, and
continuous morphology (Figure 5A and B) to also a discrete
Table 5. Comparison of d , d , d , and d values of the size and blocky morphology after solutionizing treatment,
50
90
p
10
of the precipitates in the as‑printed samples similar to the one located at grain boundaries but smaller
in size. The microstructures of both samples1075-0 and
Sample ID d (nm) d (nm) D (nm) d (nm)
10 50 90 p 1075-Y (Figure 9) consist of mostly Laves phase and δ
AP-0 37.2 51.5 84.7 62.5 phase. The presence of the δ phase after solutionizing
AP-Y 50.6 72.3 114.9 83.7 treatment is due to the following reasons. First, as Laves
A B
Figure 6. The size distribution (A) and the cumulative percentage (B) of the precipitates in the as-printed samples.
Volume 1 Issue 4 (2022) 6 https://doi.org/10.18063/msam.v1i4.25