
Page 72 - MSAM-2-3
P. 72
Materials Science in Additive Manufacturing Additive manufacturing of SiC composite
interface. This does not facilitate the stress transfer The second cycle of PIP is the onset of densification
during load bearing of the composite, thus weakening the of the ceramic-based composite specimens, and the most
mechanical properties of the composite. significant weight gain of the composite is observed at
this stage. Figure 18 shows the SEM and energy dispersive
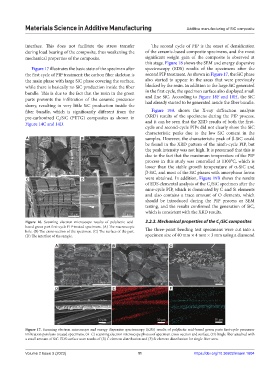
Figure 17 illustrates the basic state of the specimen after spectroscopy (EDS) results of the specimens after the
the first cycle of PIP treatment: the carbon fiber skeleton is second PIP treatment. As shown in Figure 17, the SiC phase
the main phase with large SiC phase covering the surface, also started to appear in the areas that were previously
while there is basically no SiC production inside the fiber blocked by the resin. In addition to the large SiC generated
bundle. This is due to the fact that the resin in the green in the first cycle, the specimen surface also displayed small
parts prevents the infiltration of the ceramic precursor and fine SiC. According to Figure 18F and 18H, the SiC
slurry, resulting in very little SiC production inside the had already started to be generated inside the fiber bundle.
fiber bundle, which is significantly different from the Figure 19A shows the X-ray diffraction analysis
pre-carbonized C /SiC (PETG) composites as shown in (XRD) results of the specimens during the PIP process,
f
Figure 14C and 14D. and it can be seen that the XRD results of both the first-
cycle and second-cycle PIPs did not clearly show the SiC
characteristic peaks due to the low SiC content in the
A B samples. However, the characteristic peak of β-SiC could
be found in the XRD pattern of the ninth-cycle PIP, but
the peak intensity was not high. It is presumed that this is
due to the fact that the maximum temperature of the PIP
process in this study was controlled at 1100°C, which is
lower than the stable growth temperature of α-SiC and
β-SiC, and most of the SiC phases with amorphous forms
C D were obtained. In addition, Figure 19B shows the results
of EDS elemental analysis of the C /SiC specimen after the
f
nine-cycle PIP, which is dominated by C and Si elements
and also contains a trace amount of O elements, which
should be introduced during the PIP process or SEM
testing, and the results confirmed the generation of SiC,
which is consistent with the XRD results.
Figure 16. Scanning electron microscope results of polylactic acid- 3.2.3. Mechanical properties of the C /SiC composites
f
based green part first-cycle PIP-treated specimens. (A) The macroscopic
hole. (B) The cross-section of the specimen. (C) The surface of the part. The three-point bending test specimens were cut into a
(D) The interface of the sample. specimen size of 40 mm × 4 mm × 3 mm using a diamond
A B C
D E F
Figure 17. Scanning electron microscope and energy dispersive spectroscopy (EDS) results of polylactic acid-based green parts first-cycle precursor
infiltration pyrolysis-treated specimens. (A–C) scanning electron microscope photos of specimen cross-section and surface. (D) Single fiber attached with
a small amount of SiC. EDS surface scan results of (E) C element distribution and (F) Si element distribution for single fiber area.
Volume 2 Issue 3 (2023) 11 https://doi.org/10.36922/msam.1604